16 March 2020
Red European Markets – Value and Risky Stocks Feel the Heat
At the current pace of market changes, with swinging indices on any trading day, any brave soul ready to shed the light on the downfall of equities with market patterns should be warmly welcome.
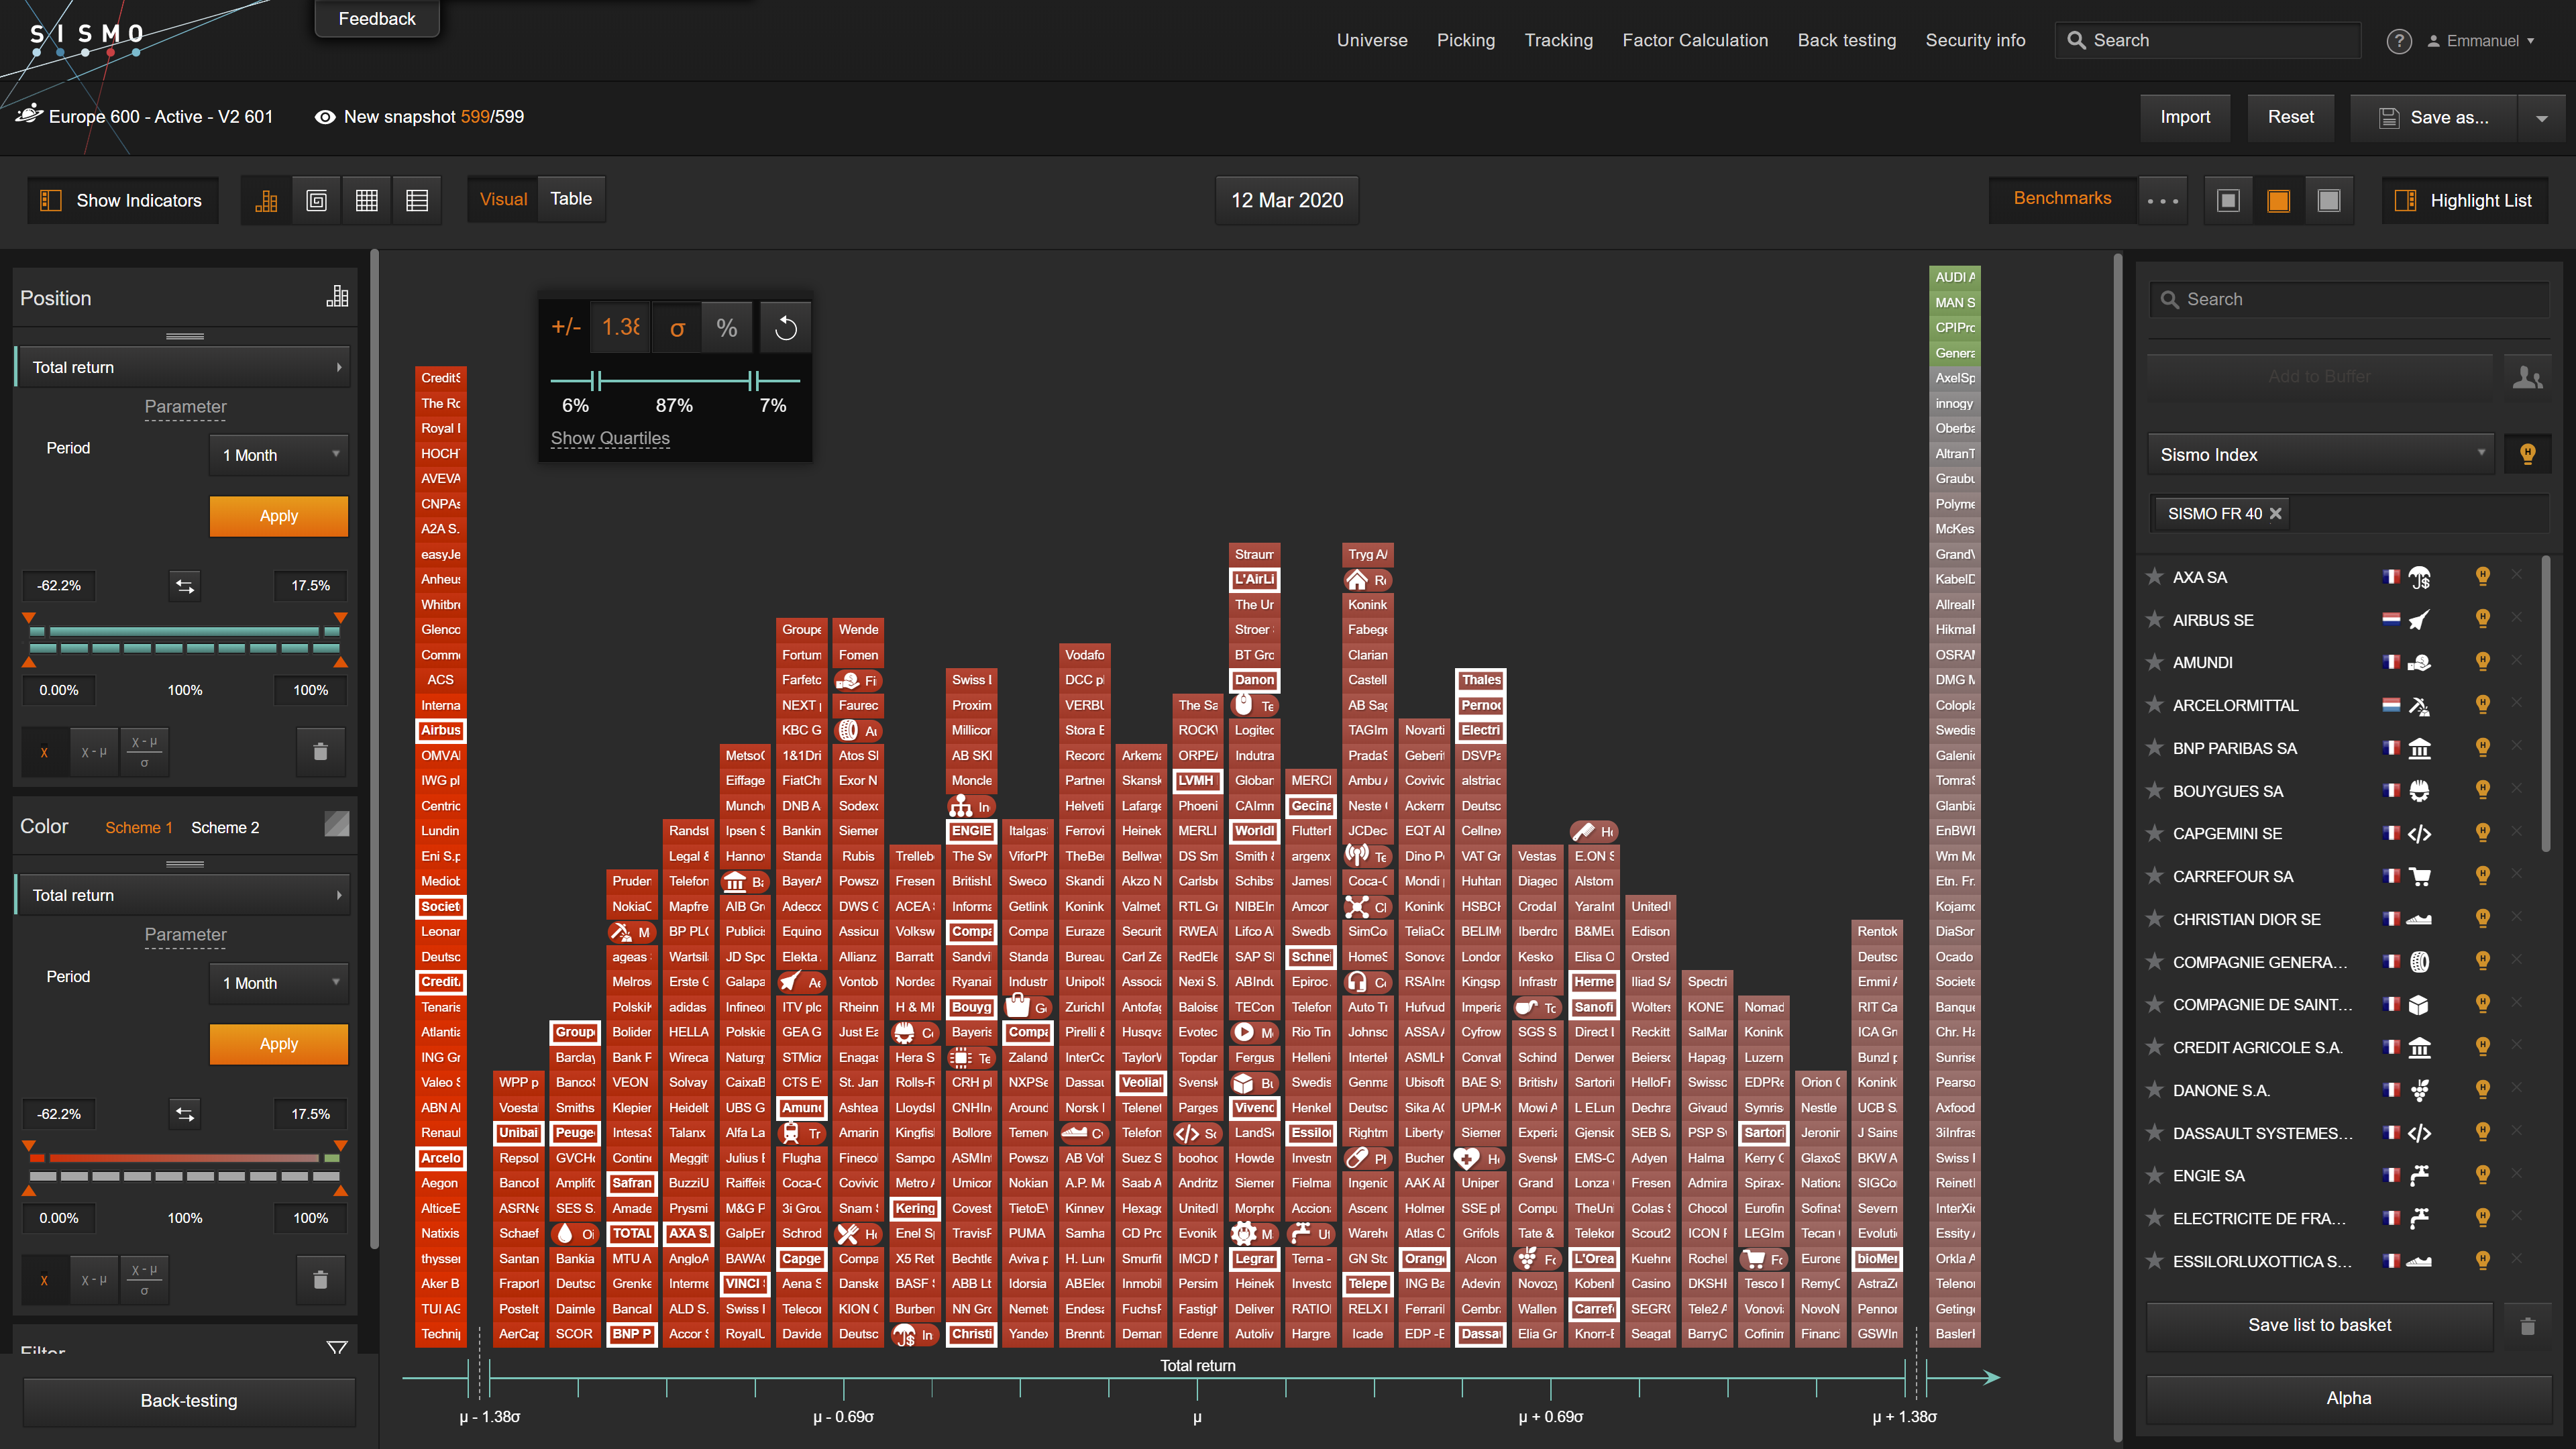
Let us be courageous then but set tight limits by sticking to what we see on Sismo screens after the sharpest downfall ever recorded on European indices on 12th March 2020: for the top 600 European stocks, the average 1-month total return stands at ‑29.5% and a quarter of the stocks exhibit a return below‑37.2%.
Fear of consequences of a virus that spreads quickly has led investors to pull out of banks, oil & gas and transportation companies, among various sectors in disgrace, before the landslide which swept everything away on 12th March 2020. Still, we can display in the chart below a somewhat crushed bell-shape distribution of returns for European stocks along the x-axis, with tails aggregated at ±1.38 standard deviation. We have added over it 30 sectors tiles positioned at sectors’ median values, standing between Oil & Gas to the left at ‑1σ from market average (‑42.8%) and Food & Drug Retail to the right at +1σ (‑17.3%).
This is Europe turned red. On top of it, we’ve highlighted with white frame the French top 40 stocks (note that 1-month total return indicator is displayed twice on the chart: along the x-axis and in the form of the color gradient from red to green).
1-Month Total Return on Top 600 European Stocks at 12th March 2020
Let’s go a step further: we keep the same 1-month distribution of return along the x-axis at 12th March and color it with a red-green gradient reflecting past stocks position relative to a few common investment styles. For this purpose, we move backward to 19th February, when European equity indices peaked, and calculate for all stocks their relative position at the time (Z-score) on our top 600 European stocks on a combination of indicators reflecting common equity investment styles that are used in Factor investing: Value, Momentum, Risk, Quality, Growth, Yield, etc.
In this manner, we can overlay present and past images, keeping current total returns along the x-axis and coloring stocks’ tiles with a red-green gradient reflecting their exposure on various investment styles in the (recent) past, at 19th February 2020.
Two investment styles stand out with striking results: Value (which favors “cheap” stocks based on a combination of market multiples) and Risk (which favors “risky” stocks with a combination of high beta, high volatility, negative skewness, etc.).
In the chart below, we keep the x-axis distribution of total returns at 12th March and color it from red to green with Value exposure at 19th February.
1-Month Total Return at 12th March 2020 vs. Value Exposure at 19th February 2020 (Top 600 Europe)
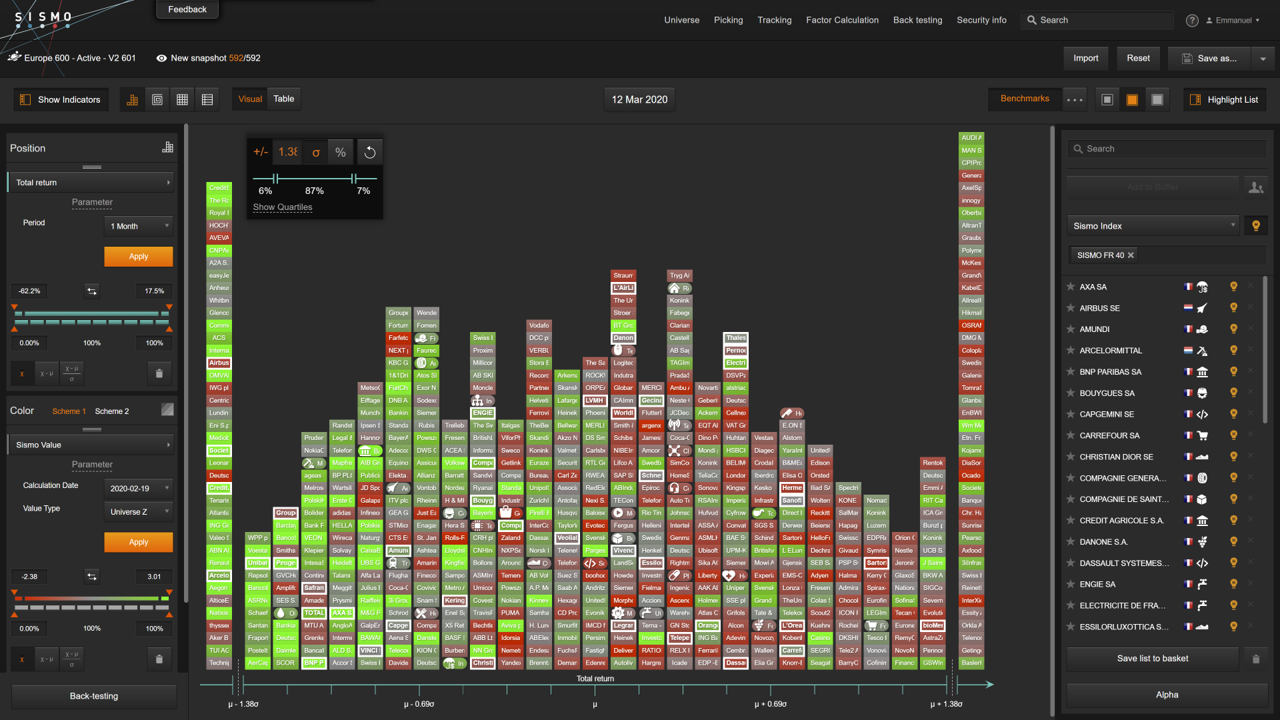
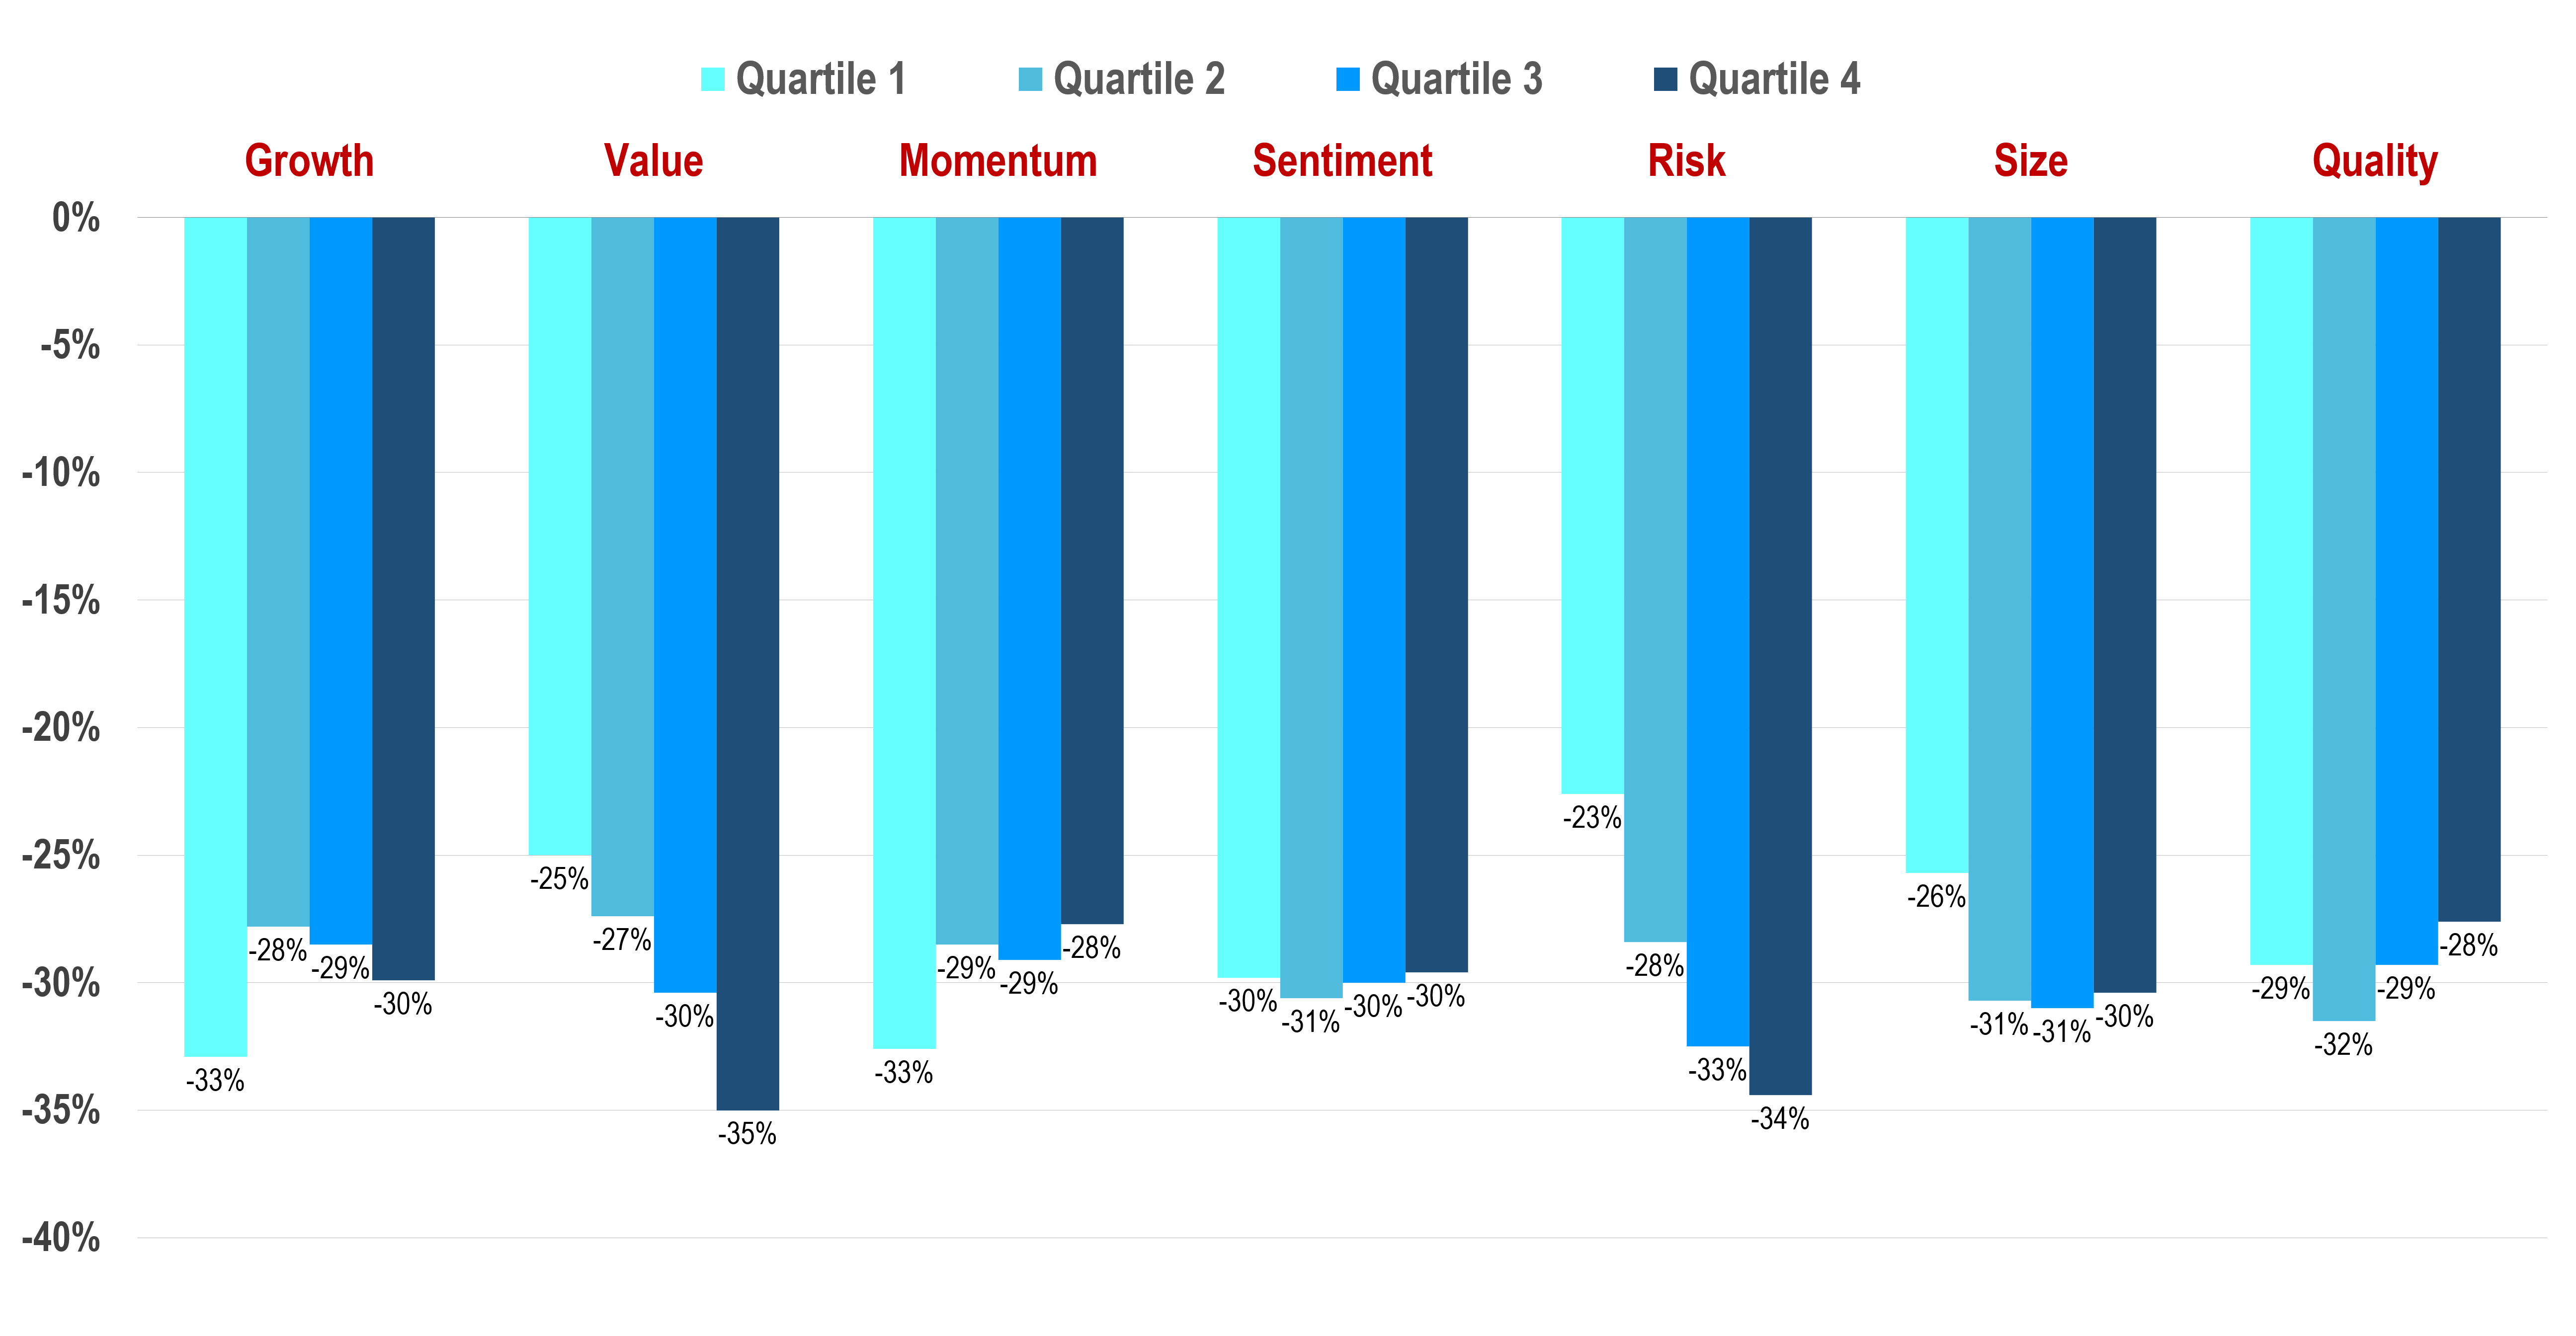
With rare exceptions, green (high Value) stocks at 19th February stand on the left side of the distribution of the 1-month return as of 12th March, highlighting the sharp fall of nearly all Value stocks (such as banks and automotive stocks). The top 25% stocks on Value exposure at 19th February later exhibit a ‑35.2% 1-month average return at 12th March, below the overall average of ‑29.5%
The same analysis is presented below with ex-ante Risk exposures and ex-post total return, with the most risky stocks at 19th February here colored in red.
1-Month Total Return at 12th March 2020 vs. Risk Exposure at 19th February 2020 (Top 600 Europe)
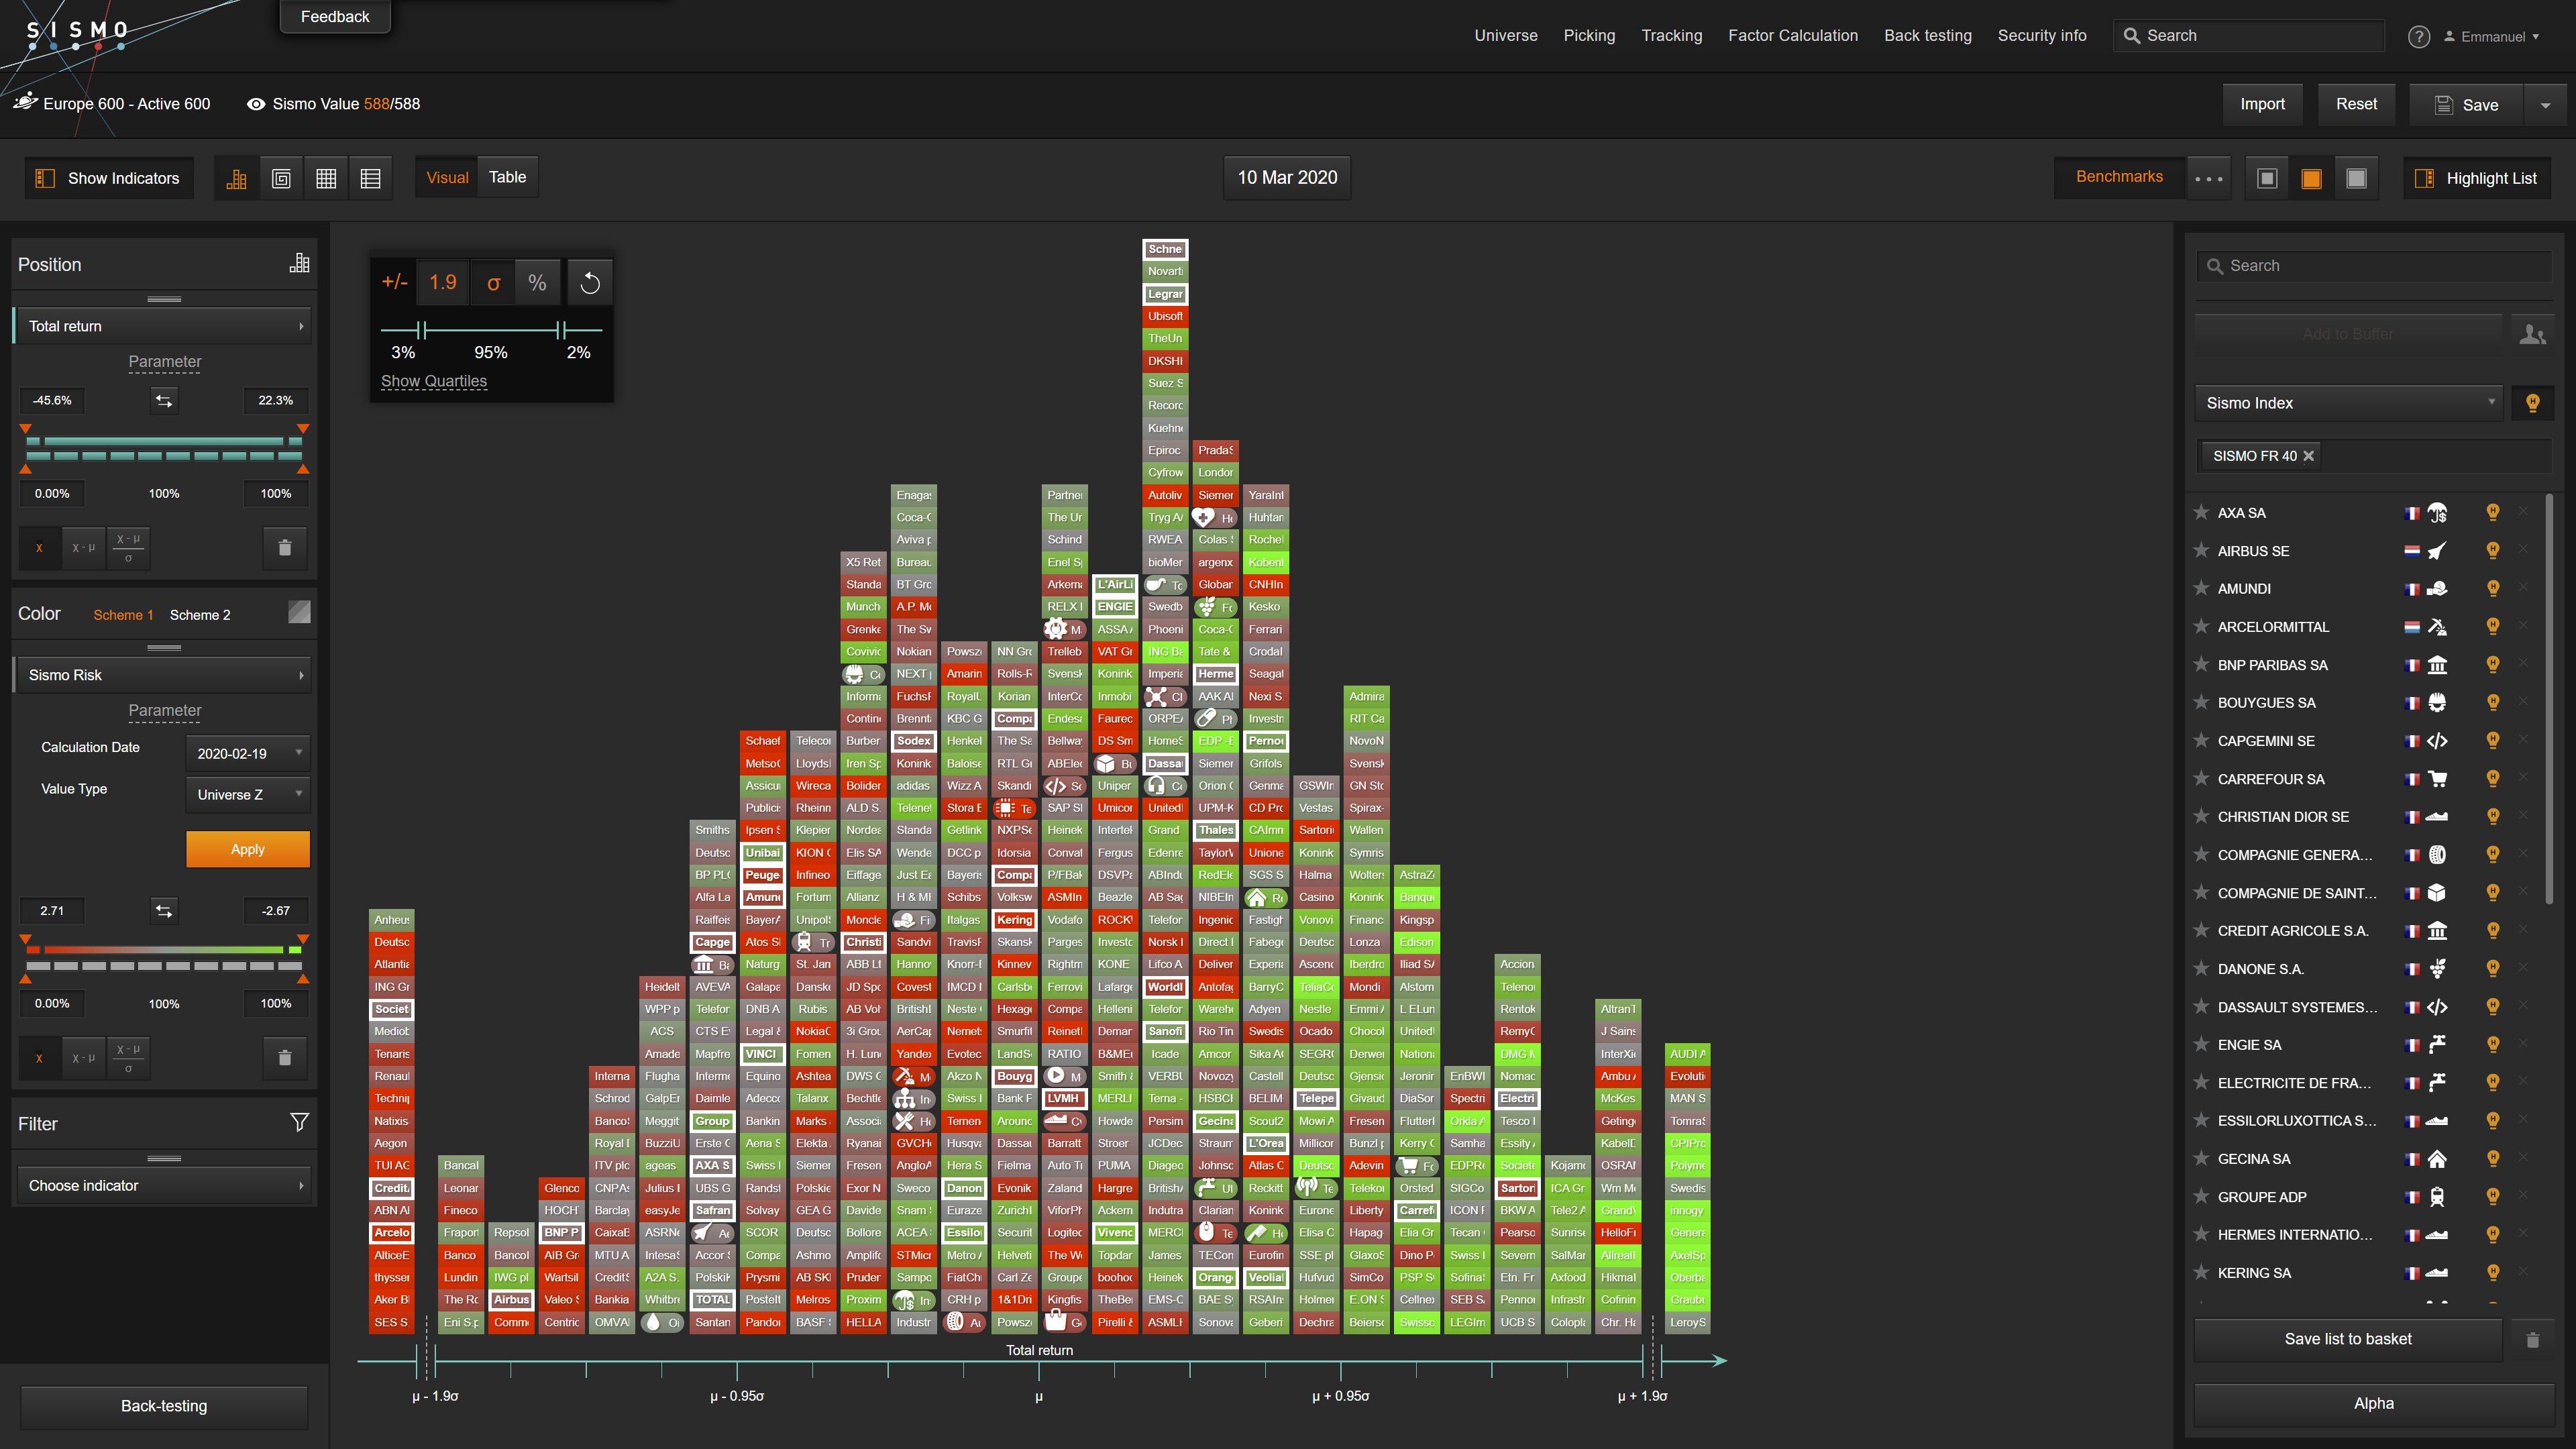
It leads to similar conclusions: most ex-ante Risk stocks (in red) are on the left part of the distribution, indicating ex-post sharp fall. Top 25% Risk-exposed stocks at 19th February exhibited a ‑34.7% 1-month total return at 12th March, well below the overall average of ‑29.5%.
So if risky stocks behaved as poorly as value stocks in recent turmoil, could they be just the same, value stocks being risky stocks?
A direct way to answer this is to display all three information together, value exposure and risk exposure at 19th February 2020 along with 1-month total return at 12th March 2020. This is what we lay out below with our “double quartile chart”: (i) from left to right along the horizontal axis, we display the Value exposure from min to max at 19th February 2020, each column representing a quartile (25%) of the distribution, (ii) from top to bottom along the vertical axis, we display the Risk exposure from min to max at 19th February 2020, each line representing a quartile of the distribution, (iii) from red to green, we display the 1-month total return from min to max at 12th of March 2020. Note that the total return distribution has been centered on its average so that the red-green gradient can be applied to distinguish below and above average stocks. Uncentered, it would be nearly all red.
1-Month Total Return at 12th March 2020 vs. Value & Risk Exposure at 19th February 2020 (Top 600 Europe)
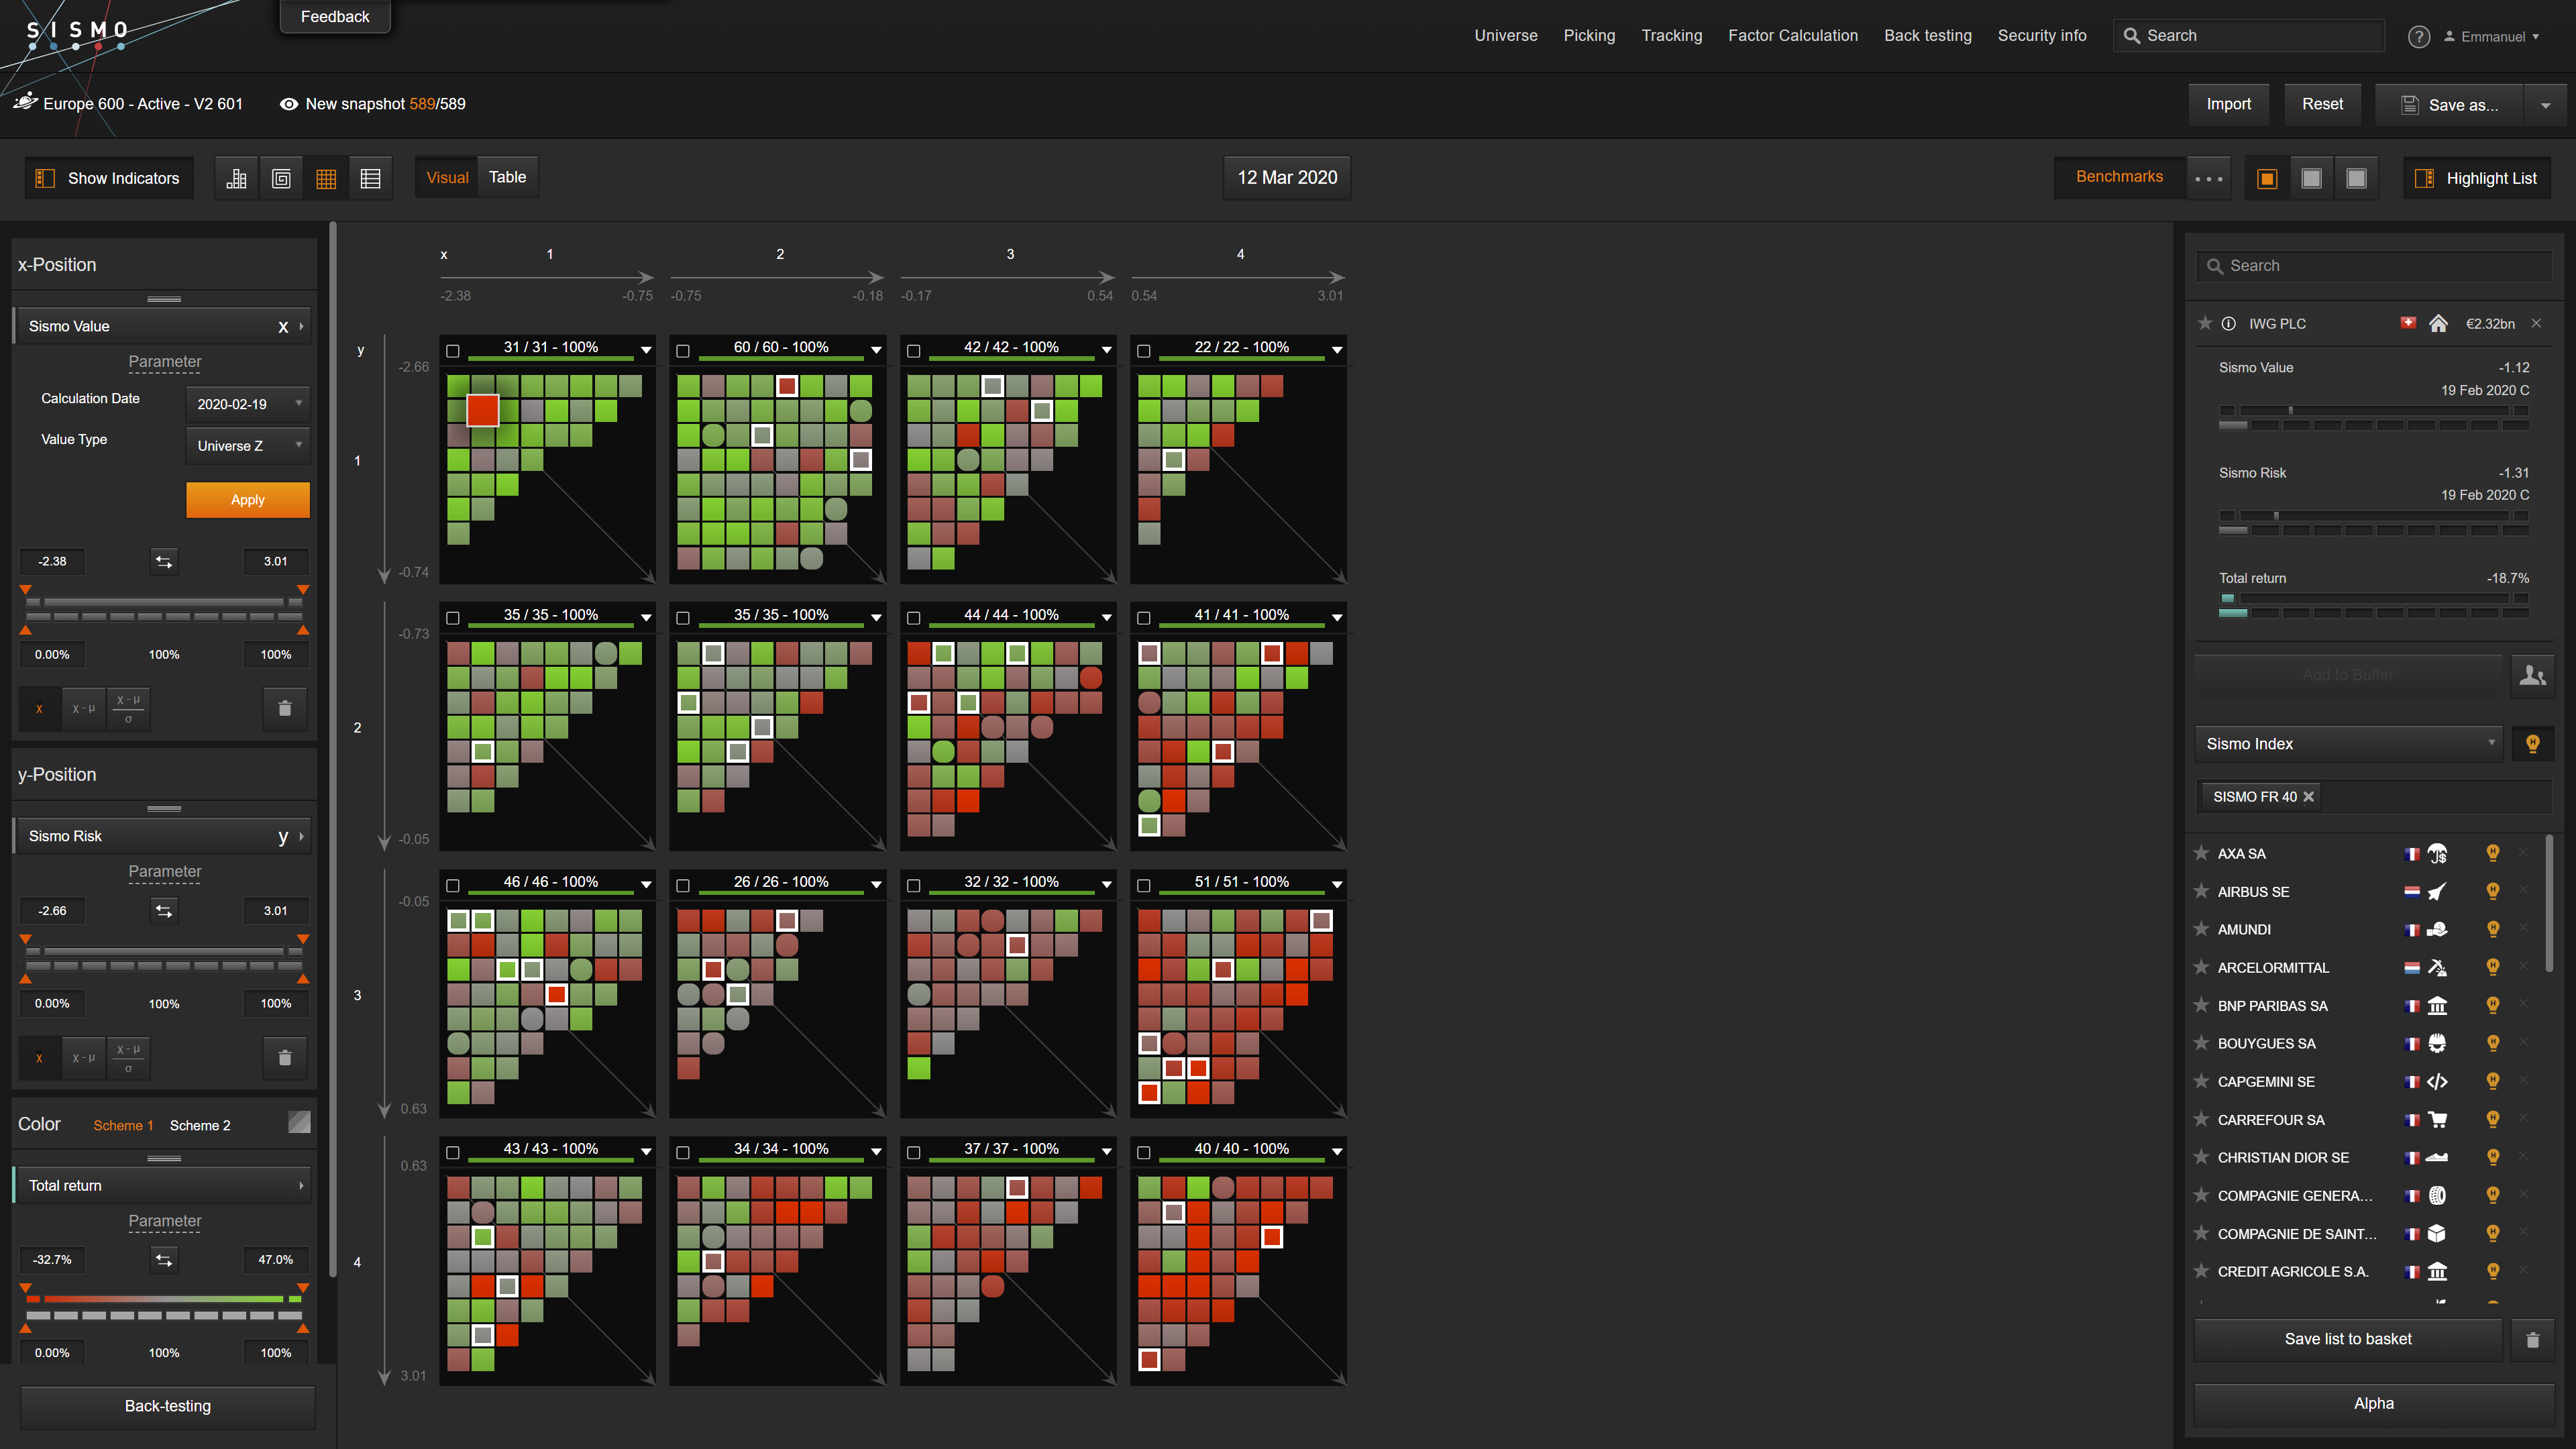
The conclusion is two-fold: (i) Risk exposure and Value exposure come with no significant correlation as of 19th February 2020 on European stocks (otherwise the diagonal on our double quartile chart would be overly populated, which is not the case), (ii) 1-month underperformance as of 12th March 2020 hit primarily stocks that hold both Value and Risk exposures (banks are the perfect example).
As of 12th March, high-risk / high-value (ie. “cheap”) stocks have been the most badly-hit victims of this sudden and sharp market downfall. However, low-risk/low-value stocks were not all shielded from direct and brutal impact. Look closely at the red tile in the green valley that we’ve highlighted in the top-left block of our chart. Guess who that is? The “world’s largest provider of flexible workspace”, IWG plc, the listed holding company of the Regus Group plc, which operates 3388 offices in 110 countries… A steady business, but maybe not the most enticing place to be in epidemic times!
*
Note: To give you a sense of other ex-ante factors behavior in recent turmoil, we show below the 1-month average total return of European stocks, grouped per quartile according to their exposure to common investment styles at 19th February 2020.
2,391 total views, 2 views today
