
18 March 2020
A Glimpse at the Unreported: Checking Relative Liquidity on European Equities
Over the last month, the top 600 European stocks have lost on average a third of their value, in trading volumes that were twice larger than usual (around 10% of free float vs. 5% in normal times). On “liquidity” ranking, Deutsche Lufthansa tops European equities with 80% of shares traded in the last month, four times more than usual.
Liquidity is not usually a differentiating factor among the largest capitalizations that can all be traded smoothly. But, in the exceptional times which we’re going through, it seems to reflect contrasting profiles in the bloodshed equity market.
On the chart below, we display the distribution of the top 600 European stocks per their 1-month liquidity along the x-axis, with stocks in the right tail aggregated above 1.6 standard deviations. We’ve added 30 sector tiles positioned per the median values of the stocks in each sector, ranging from Food & Beverages to the left at -0.5 σ from average (at 10.3%) to Semiconductors to the right at +1 σ.
1-Month Volume Traded / Float on Top 600 European Stocks at 16th March 2020
We have colored the above distribution in the chart below with a green-red gradient reflecting the relative 1-month total return of stocks, where flashy green stocks are those that fared (relatively!) well and dark red those that fell sharply. We have also highlighted the French top 40 stocks with white frames.
1-Month Volume Traded / Float vs. 1-Month Total Return on Top 600 European Stocks at 16th March 2020
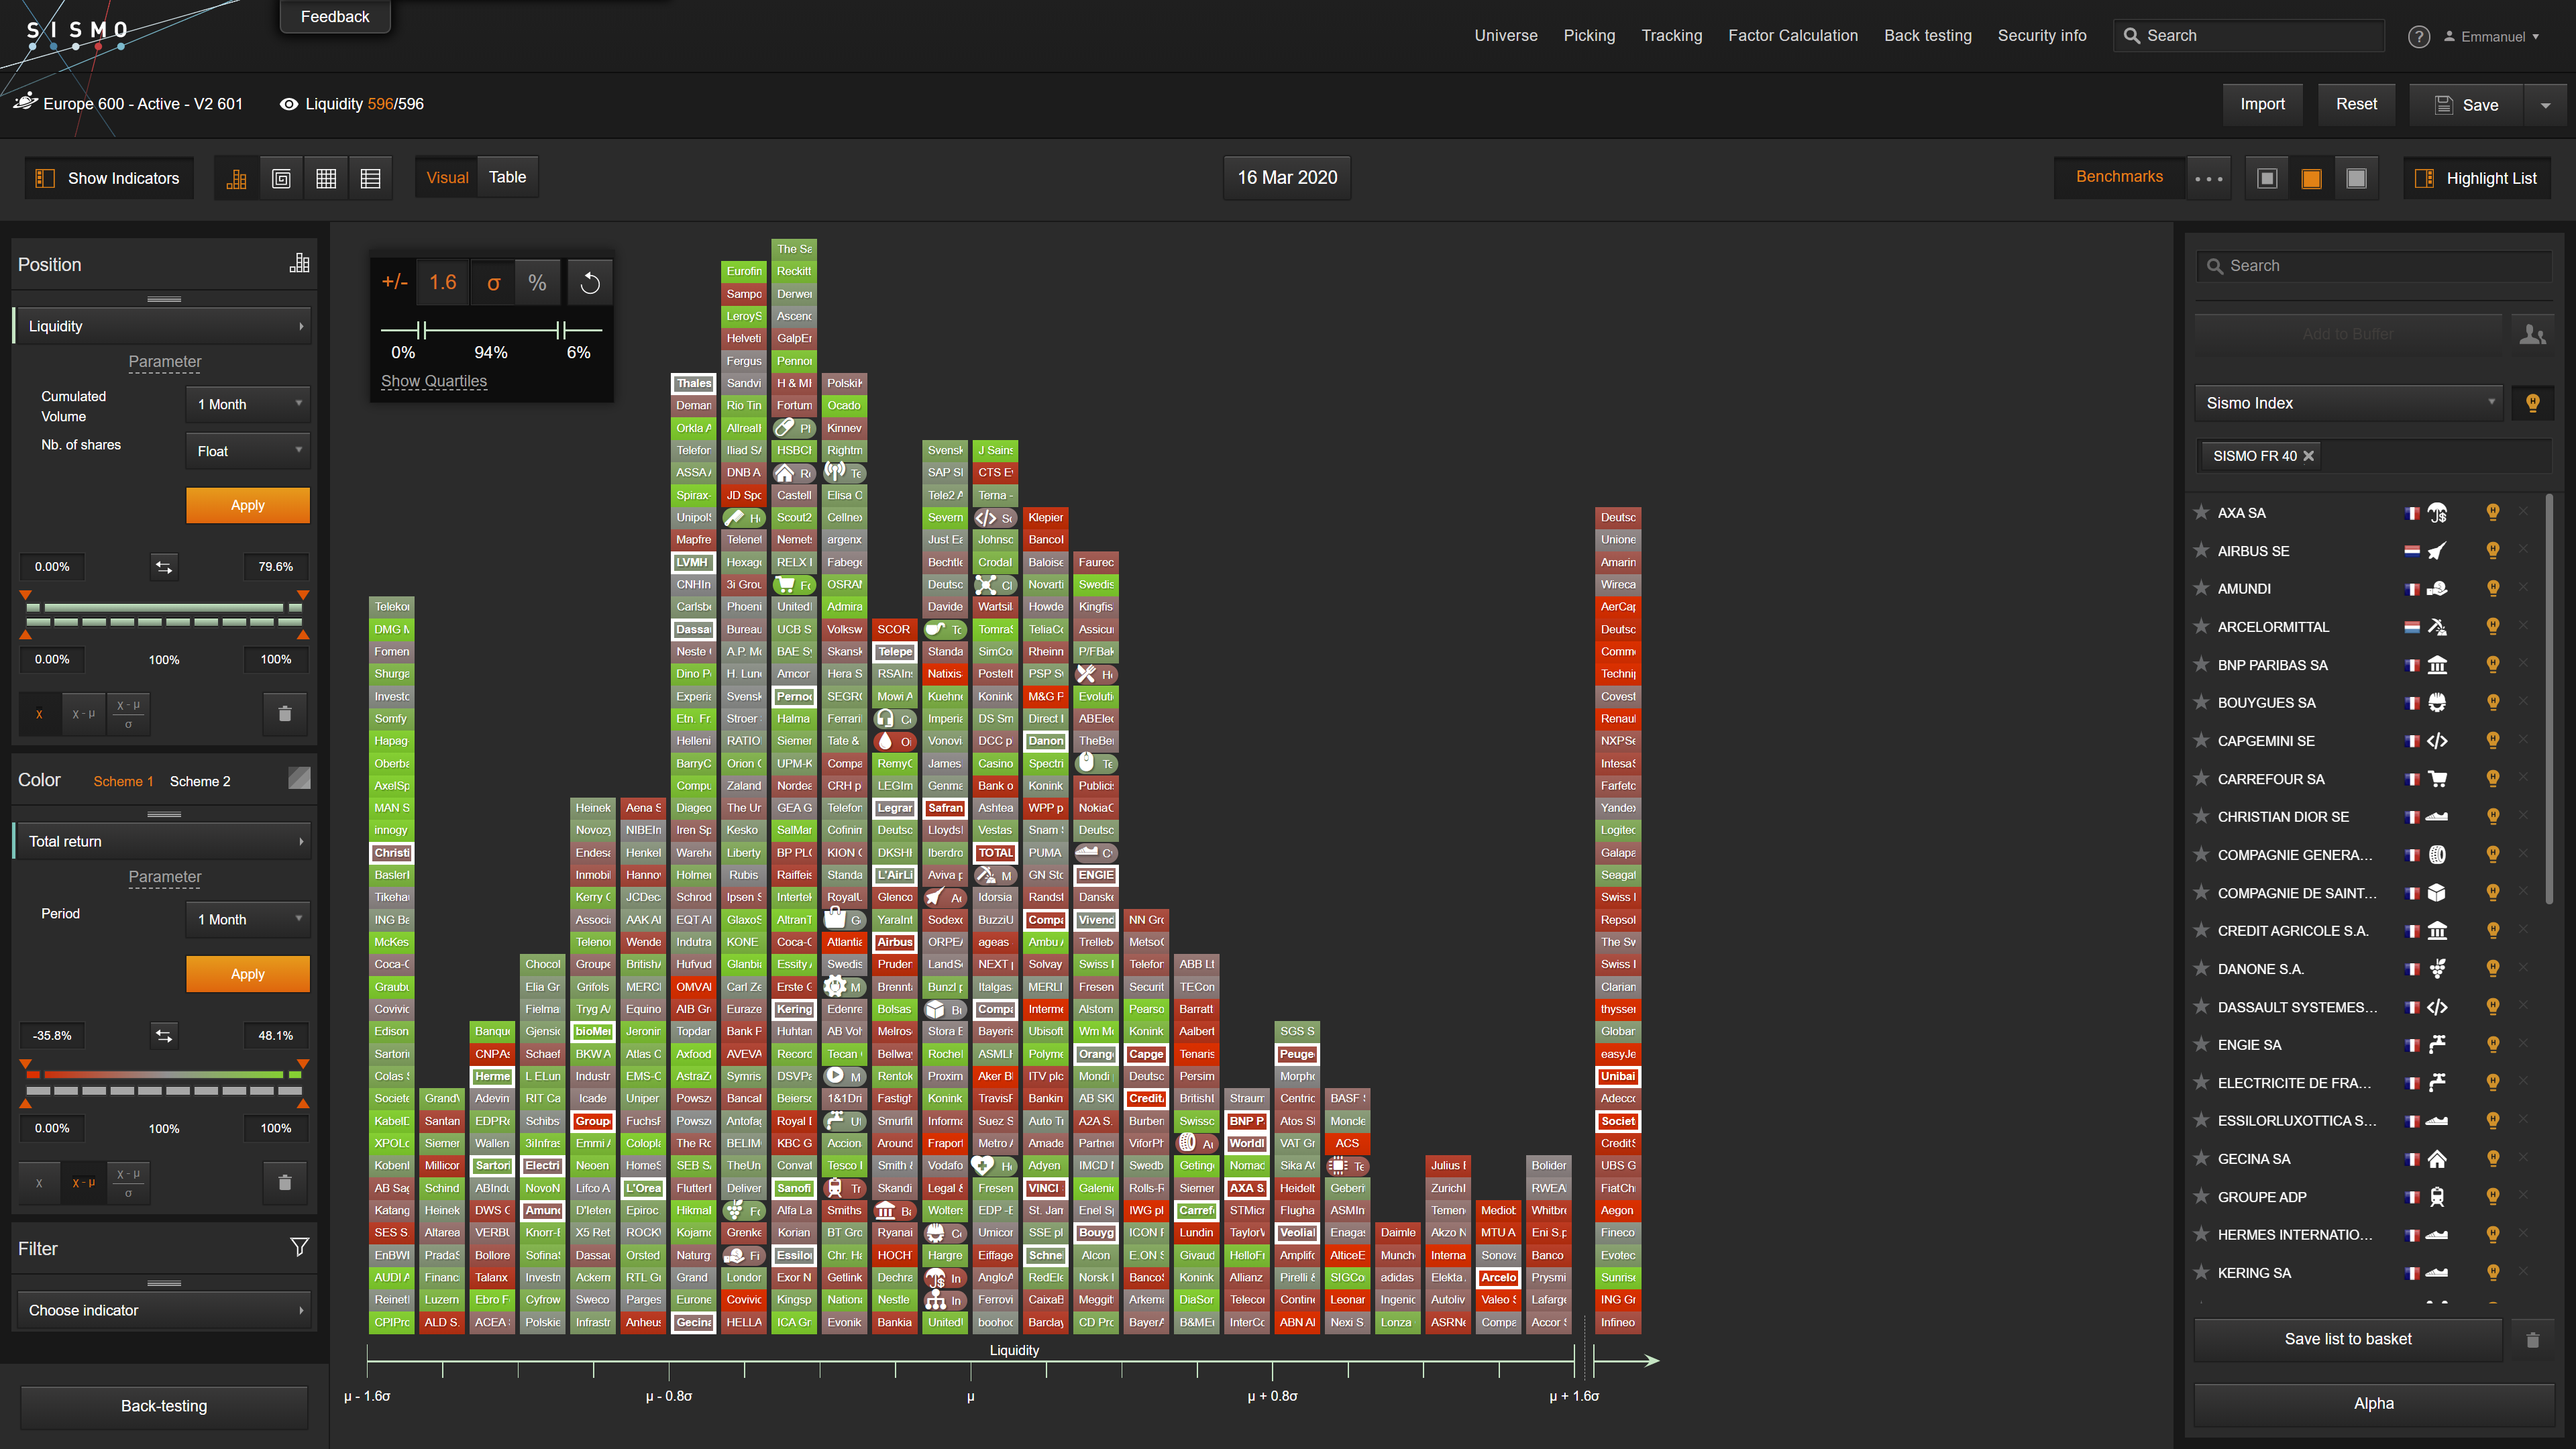
The correlation is obvious with a red pattern on most liquid stocks at the right end of the distribution as expected, highlighting stocks from which investors have fled. But the liquidity positioning does not replicate the whole sector belonging, with banks, for instance, overall widely downgraded but spread all across the above distribution.
Sismo factor analysis allows us to get one step further. In the polar chart below, we compare the average exposure on most common investment factors of stocks in the bottom decile of liquidity (in white) and of stocks in the top decile of liquidity (in red).
Factor Exposures on Bottom Decile and Top Decile of Liquidity at 16th March 2020
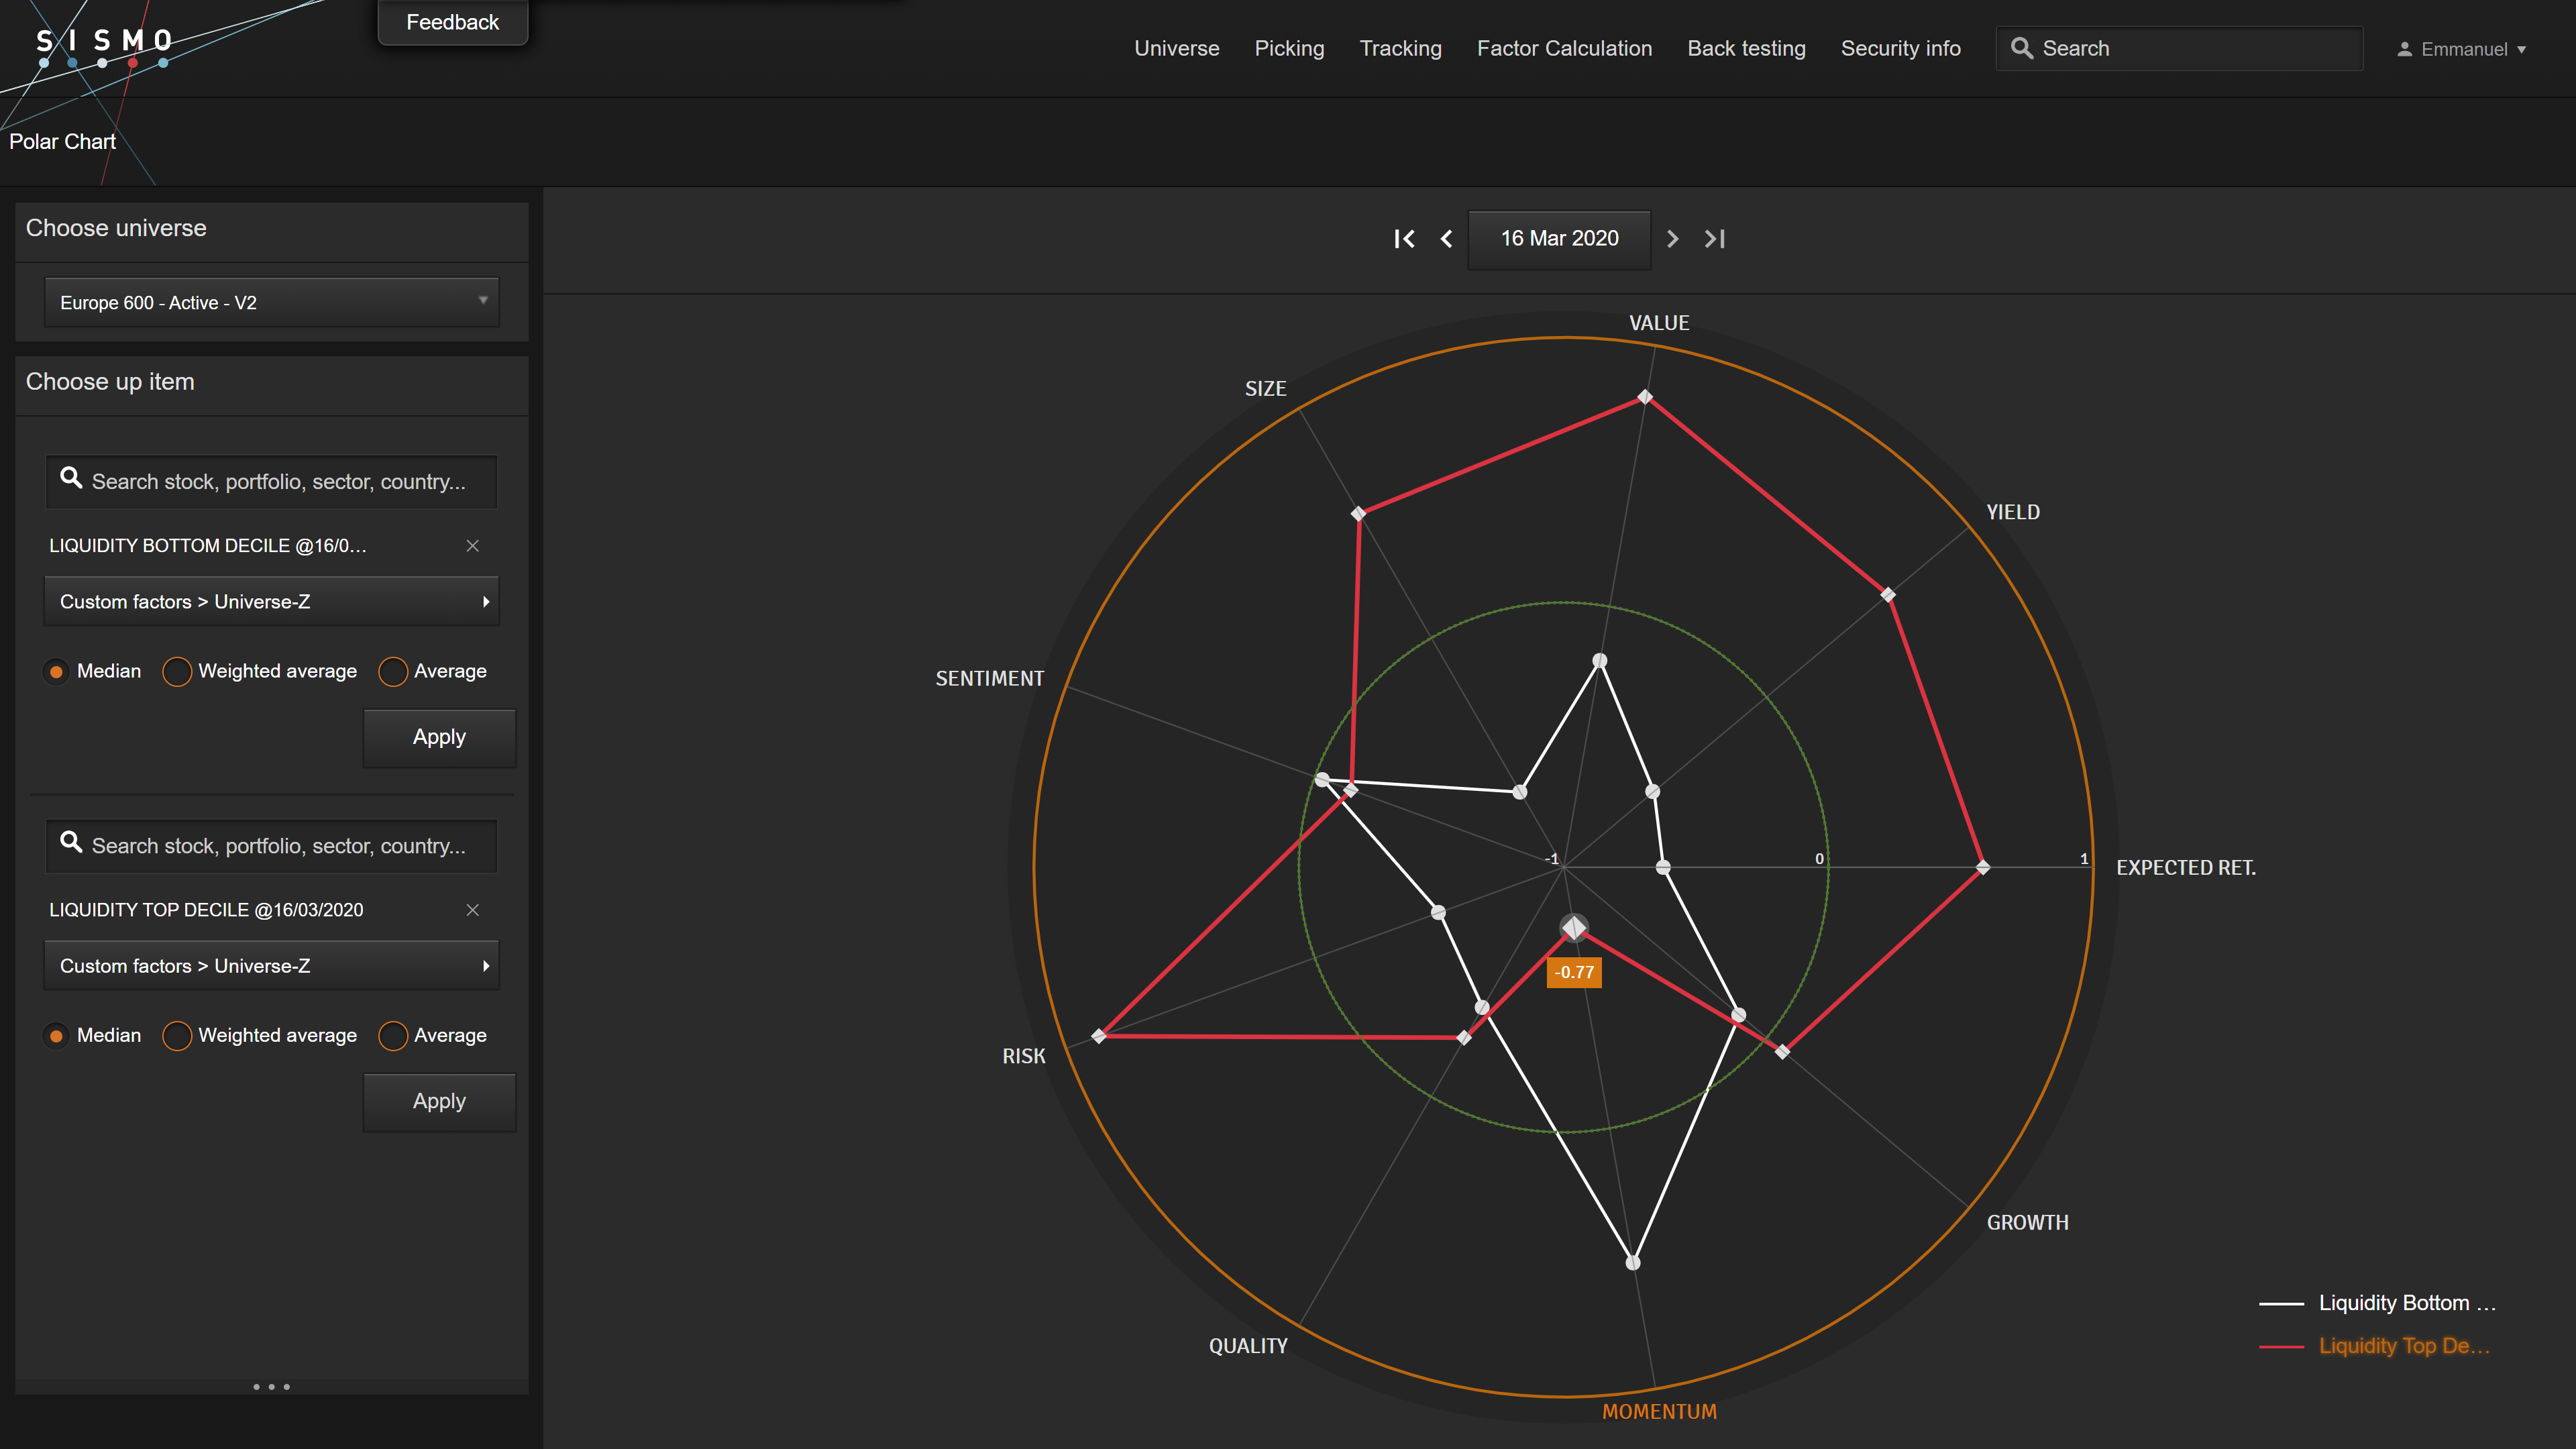
The contrast is striking between the most liquid stocks (with negative momentum, high value, high risk) and the least liquid ones (with better relative return and lower risk). In this market downturn, relative liquidity seems to embed more differentiating information than in usual times.
So, is investing in relatively low liquid stocks among blue chips the right strategy in current times? Obviously no clear conclusion here, as unduly slashed stocks in high volumes could bounce back later in different circumstances. However back-tests in the 2007-2008 periods tend to show slightly better resistance in downturn associated with the (relatively) least liquid large stocks.
*
2,297 total views, 1 views today