
02 March 2020
Which Factors outperformed in 2019?
It is never too late to revive a blog, even amid market turmoil. Turning our attention to stock performance in year 2019 may seem out of touch with current concerns, with soaring volatility and fear of global recession. Maybe it is not though and could help decipher what lies ahead.
In this post, we look at successful equity strategies in 21019 with the latest addition in Sismo’s analysis toolkit: “Factors”.
In the meaning we ascribe to this term, Factors are single linear combination of indicators that are designed to accurately describe the investment style of the portfolio manager.
In Sismo, PMs can create their own factors for stock selection (such as a Growth or Value factor) but also control factors (such as Risk, Brokers’ Sentiment or Momentum for instance) to avoid unwanted exposures. Each of the 80 indicators available in Sismo can be used as a component to a Factor.
Portfolio managers design and use Factors to ensure alignment of their portfolio and holdings with their own investment style, screen the markets along relevant perspectives and get investment recommendations aligned with their strategy.
So, which investment strategy performed best in 2019? To answer this question, we start here by defining 7 simple Factors, each based on 3 or 4 indicators:
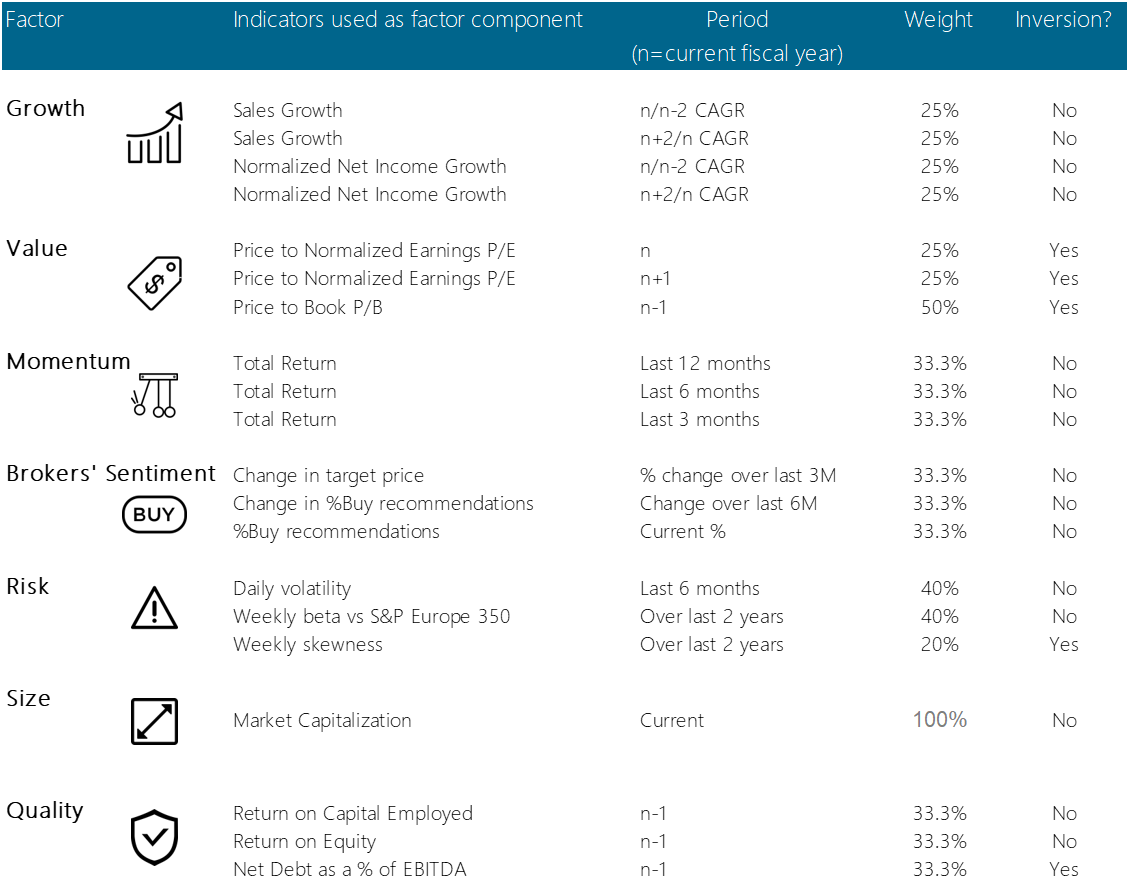
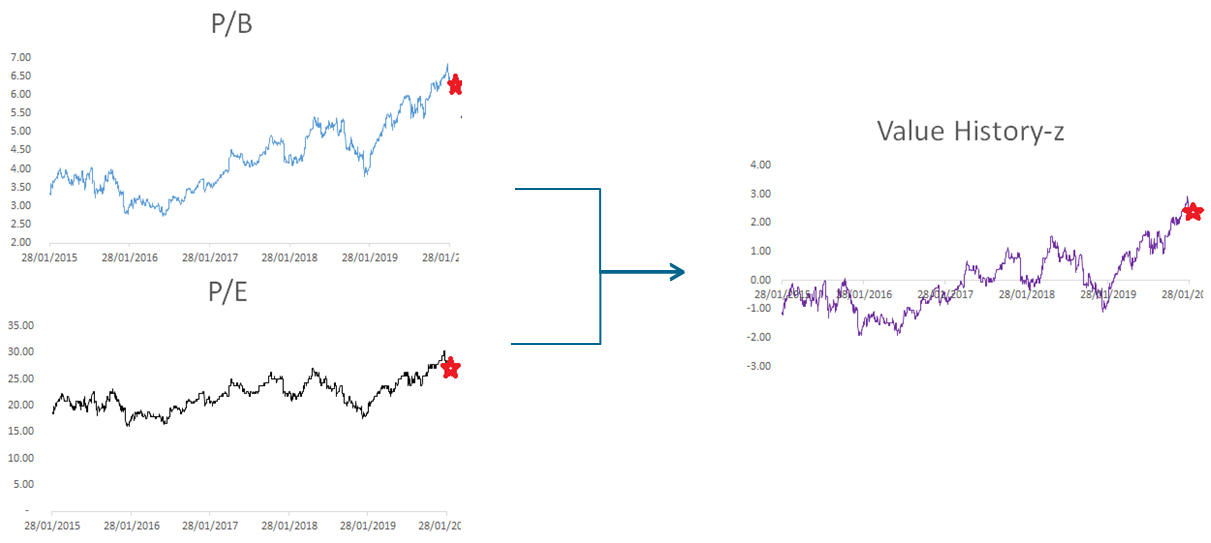
A stock has a Factor value at a given date which depends on the playground of the PM (it’s “stock universe”) and reflects the stock’s relative position on such universe on selected metrics (indicators). For each indicator (that is a component of the Factor), we calculate the stock Factor value as a standard “Z-score” by subtracting from the indicator’s value on the stock the universe mean and then dividing it by its standard deviation. The Factor value for a stock is thus the weighted average of its Z-score components, with weights reflecting those of each indicator in the definition of the Factor.
Stocks can be ranked according to each Factor values to answer questions such as “is LVMH more or less expensive than Kering” (per our own customized “Value” metric) or which sectors ranks among the cheapest.
We first define two universes:
- US 500: a proxy for the S&P 500 index, combining the 500 largest US companies at year-end 2018
- Europe 600: a proxy for the Stoxx 600 index, combining the 600 largest European companies at year-end 2018
We calculate the Factor values for all stocks in each universe at the end of December 2018, calculate their subsequent 2019 total return and take advantage of Sismo charts to highlight correlations between factor rankings and ex-post total returns. Here below, the analysis is carried out successively on all 7 factors introduced.
Growth Factor
The Sismo “double-quartile” chart below conveys the whole “Growth” information (as we have defined it) on the constituents of the US 500 (left) and Europe 600 (right) as at 31 December 2018 and their subsequent 2019 total returns. It should be read as follows:
- Each stock in the universe is represented by a square tile positioned with X-Y coordinates from top left corner per the first 2 indicators
- Growth Factor positioning as at 2018 year-end is distributed in quartile along the X axis, from left (most negative) to right (most positive), with each column accounting for 1/4th of all stocks. Low Growth stocks are thus in the 1stcolumn from the left while high Growth stocks are in the 4th column, right.
- 2019 total return works the same way but is distributed in rows rather than columns, from bottom quartile (in 1st row) to top quartile (in 4throw) at the bottom of the screen.
- In addition, we group stocks into 4 quartiles according to their exposure to the Value Factor:
-
- Q1 : 25% of the stocks with lowest exposure to Growth (low Growth)
- …
- Q4: 25% of the stocks with lowest exposure to Growth (high Growth)
- We also position the average of each quartile on the same chart, in the form of circle tiles. Factor quartiles are colored according to the following logic :
-
- Q1 : red
- Q2: orange
- Q3: moderate green
- Q4: green
Growth Factor positioning vs 2019 performance – US universe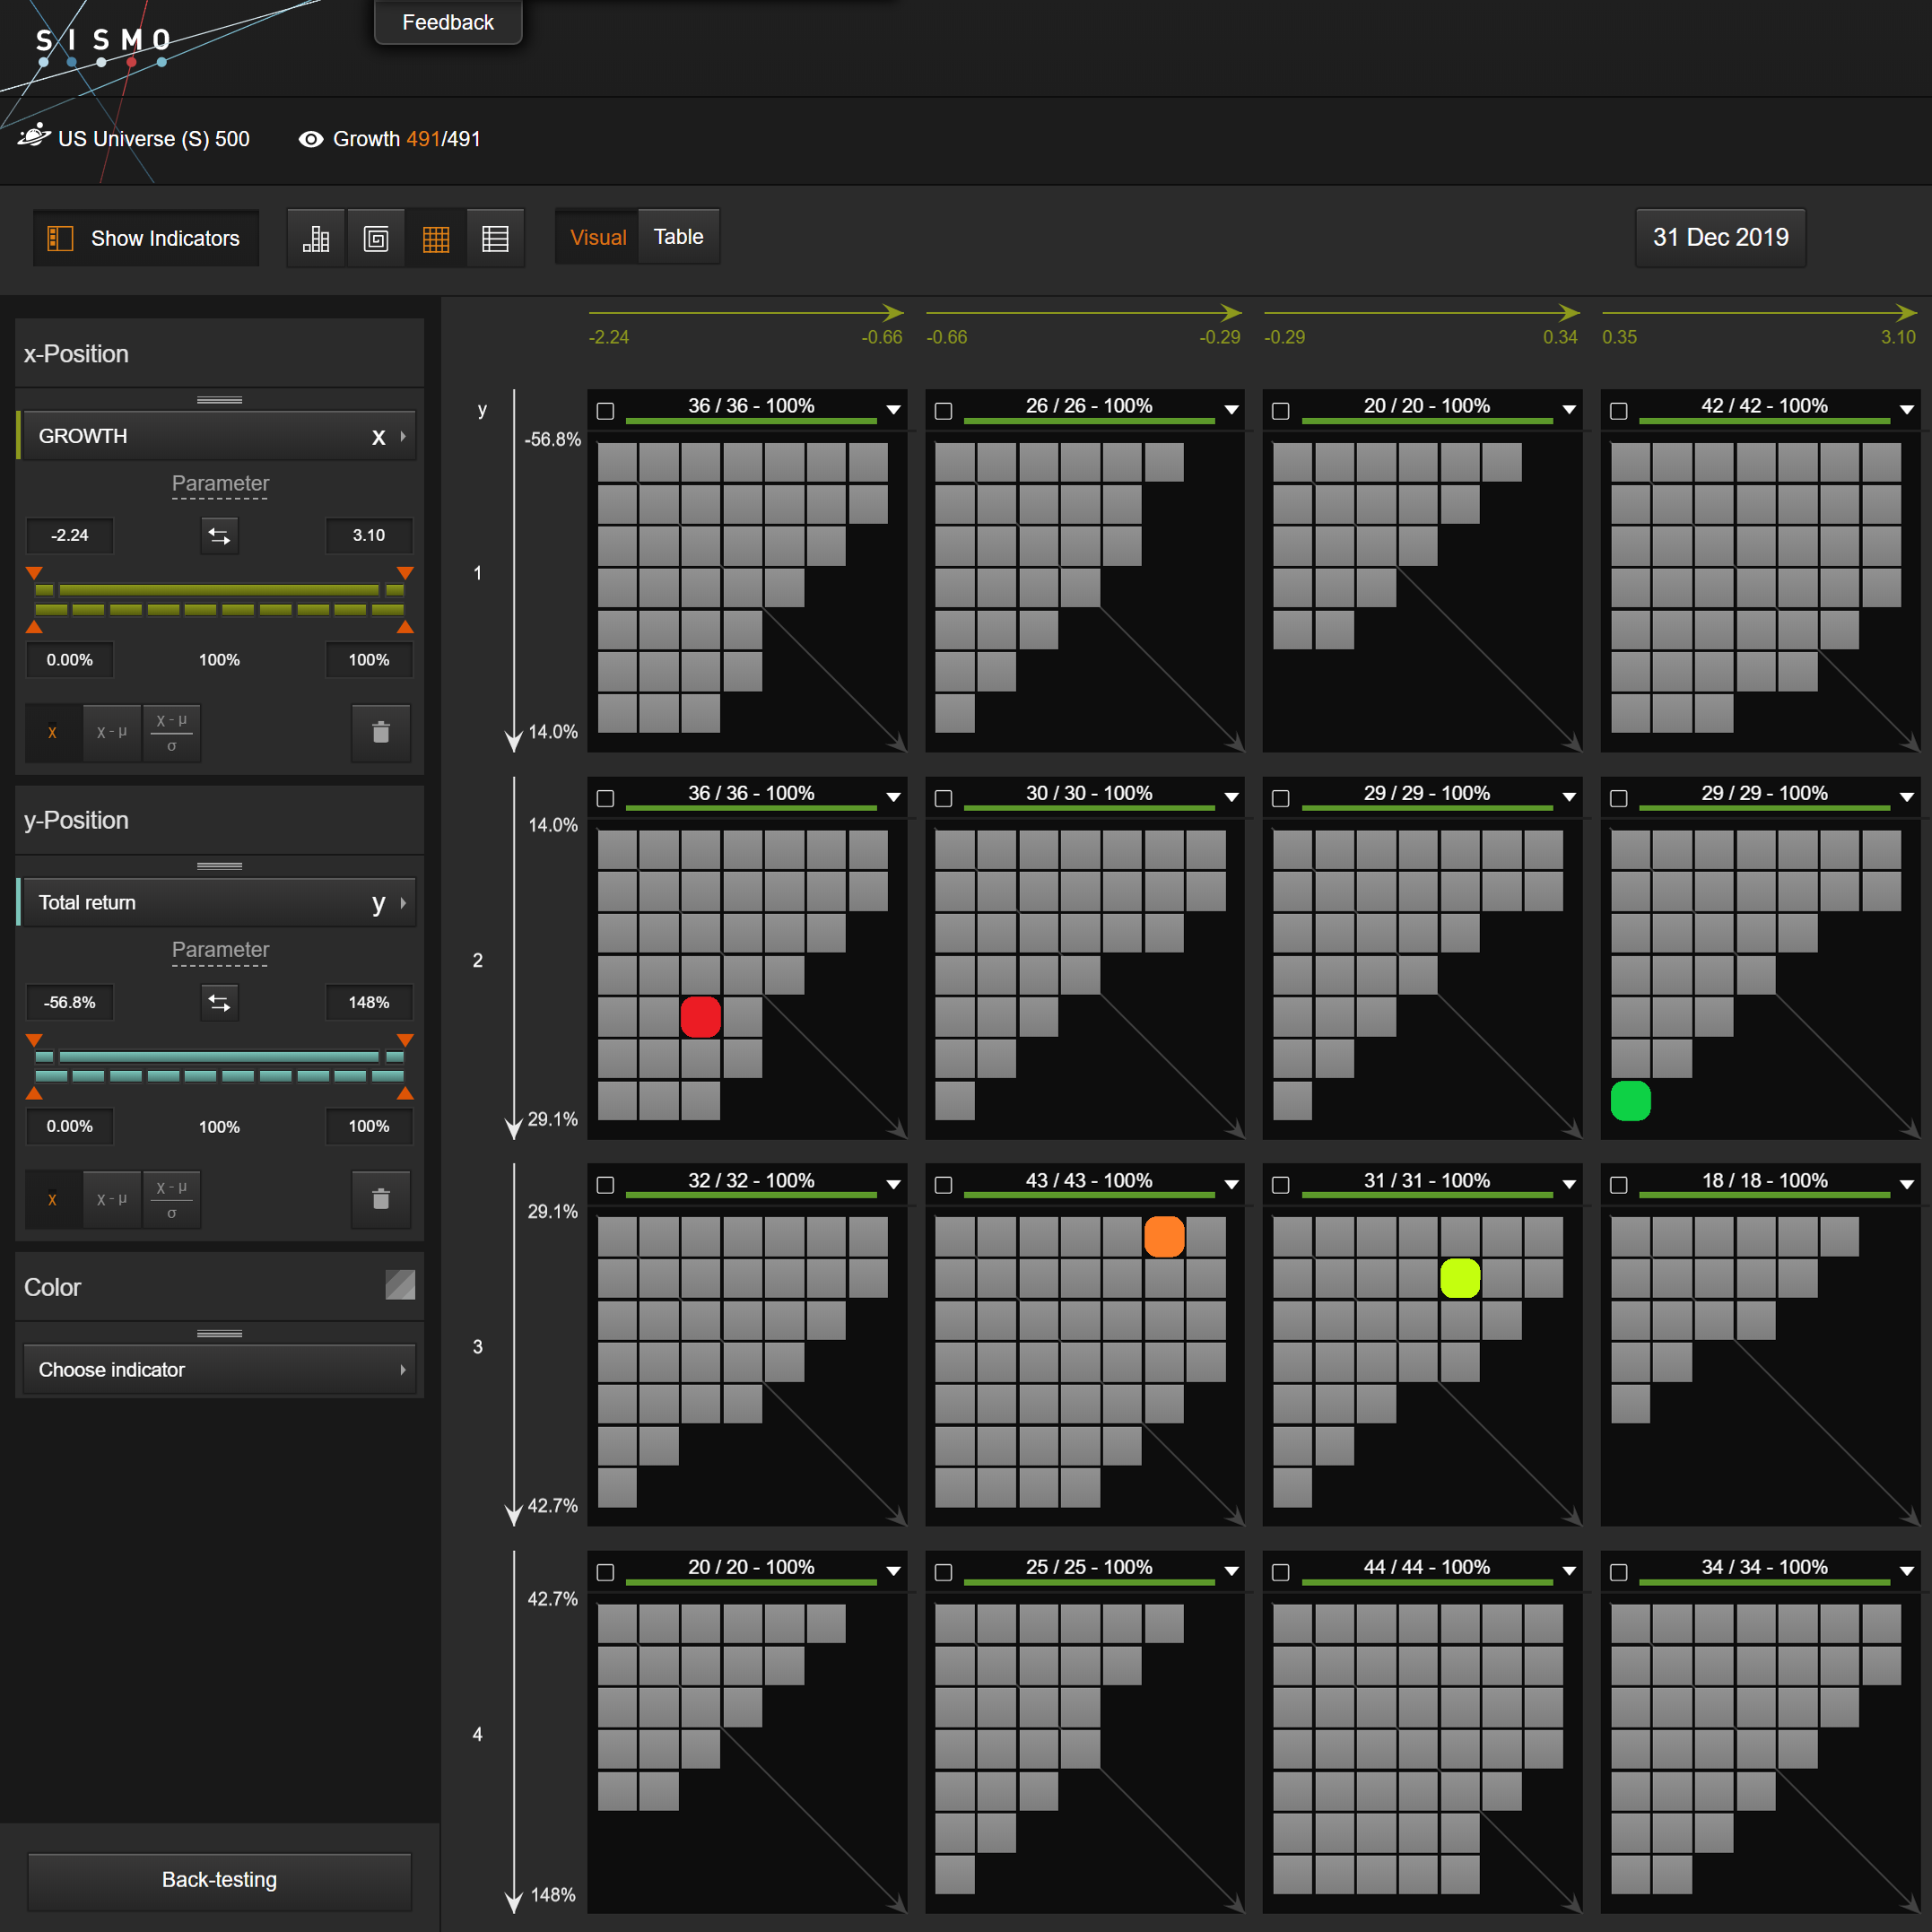
US : there was no clear pattern in 2019. Stocks with moderate Growth (Q2 & Q3) outperformed both high and low Growth stocks.
Growth Factor positioning vs 2019 performance – Europe universe 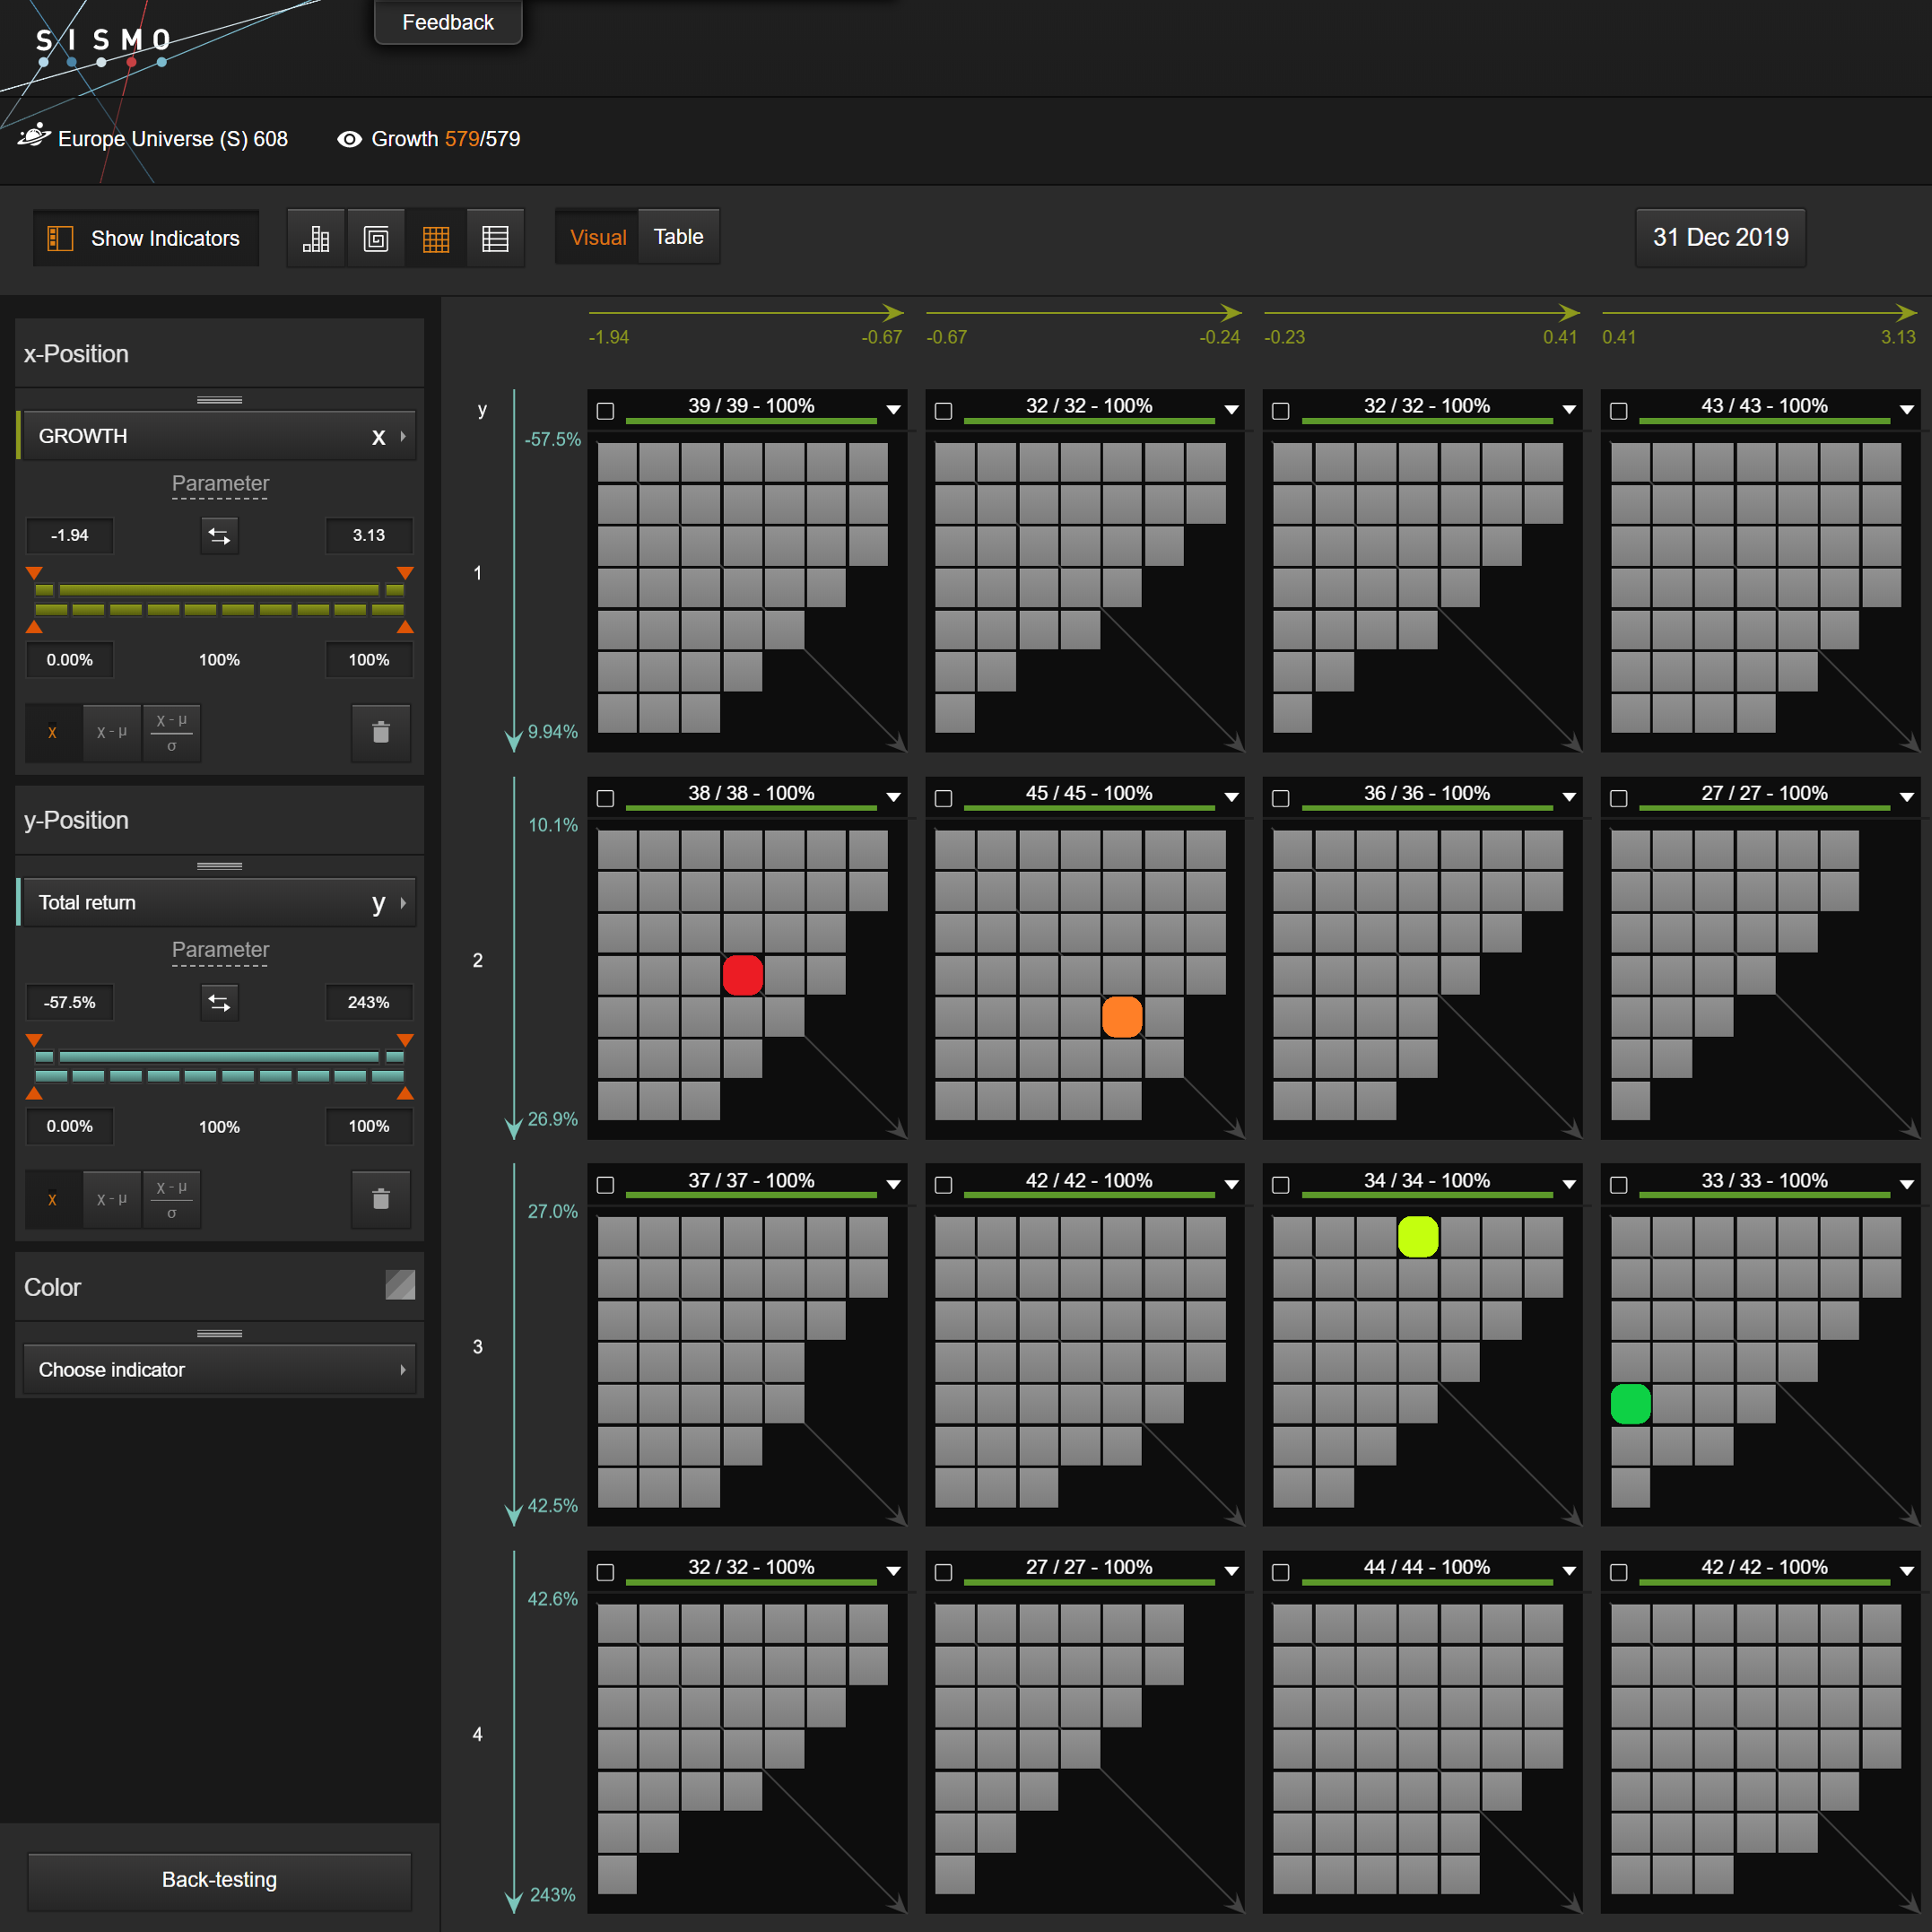
EU : high Growth (Q3 & Q4) stocks outperformed low Growth stocks by 4-6%. Among the high Growth best performers are Hapag Lloyd (+243%), Delivery Hero (+117%) and Zalando (+101%).
Value Factor
Value measures the expensiveness of stocks in terms of multiples. The higher the exposure, the cheaper the stock.
Value Factor positioning vs 2019 performance – US universe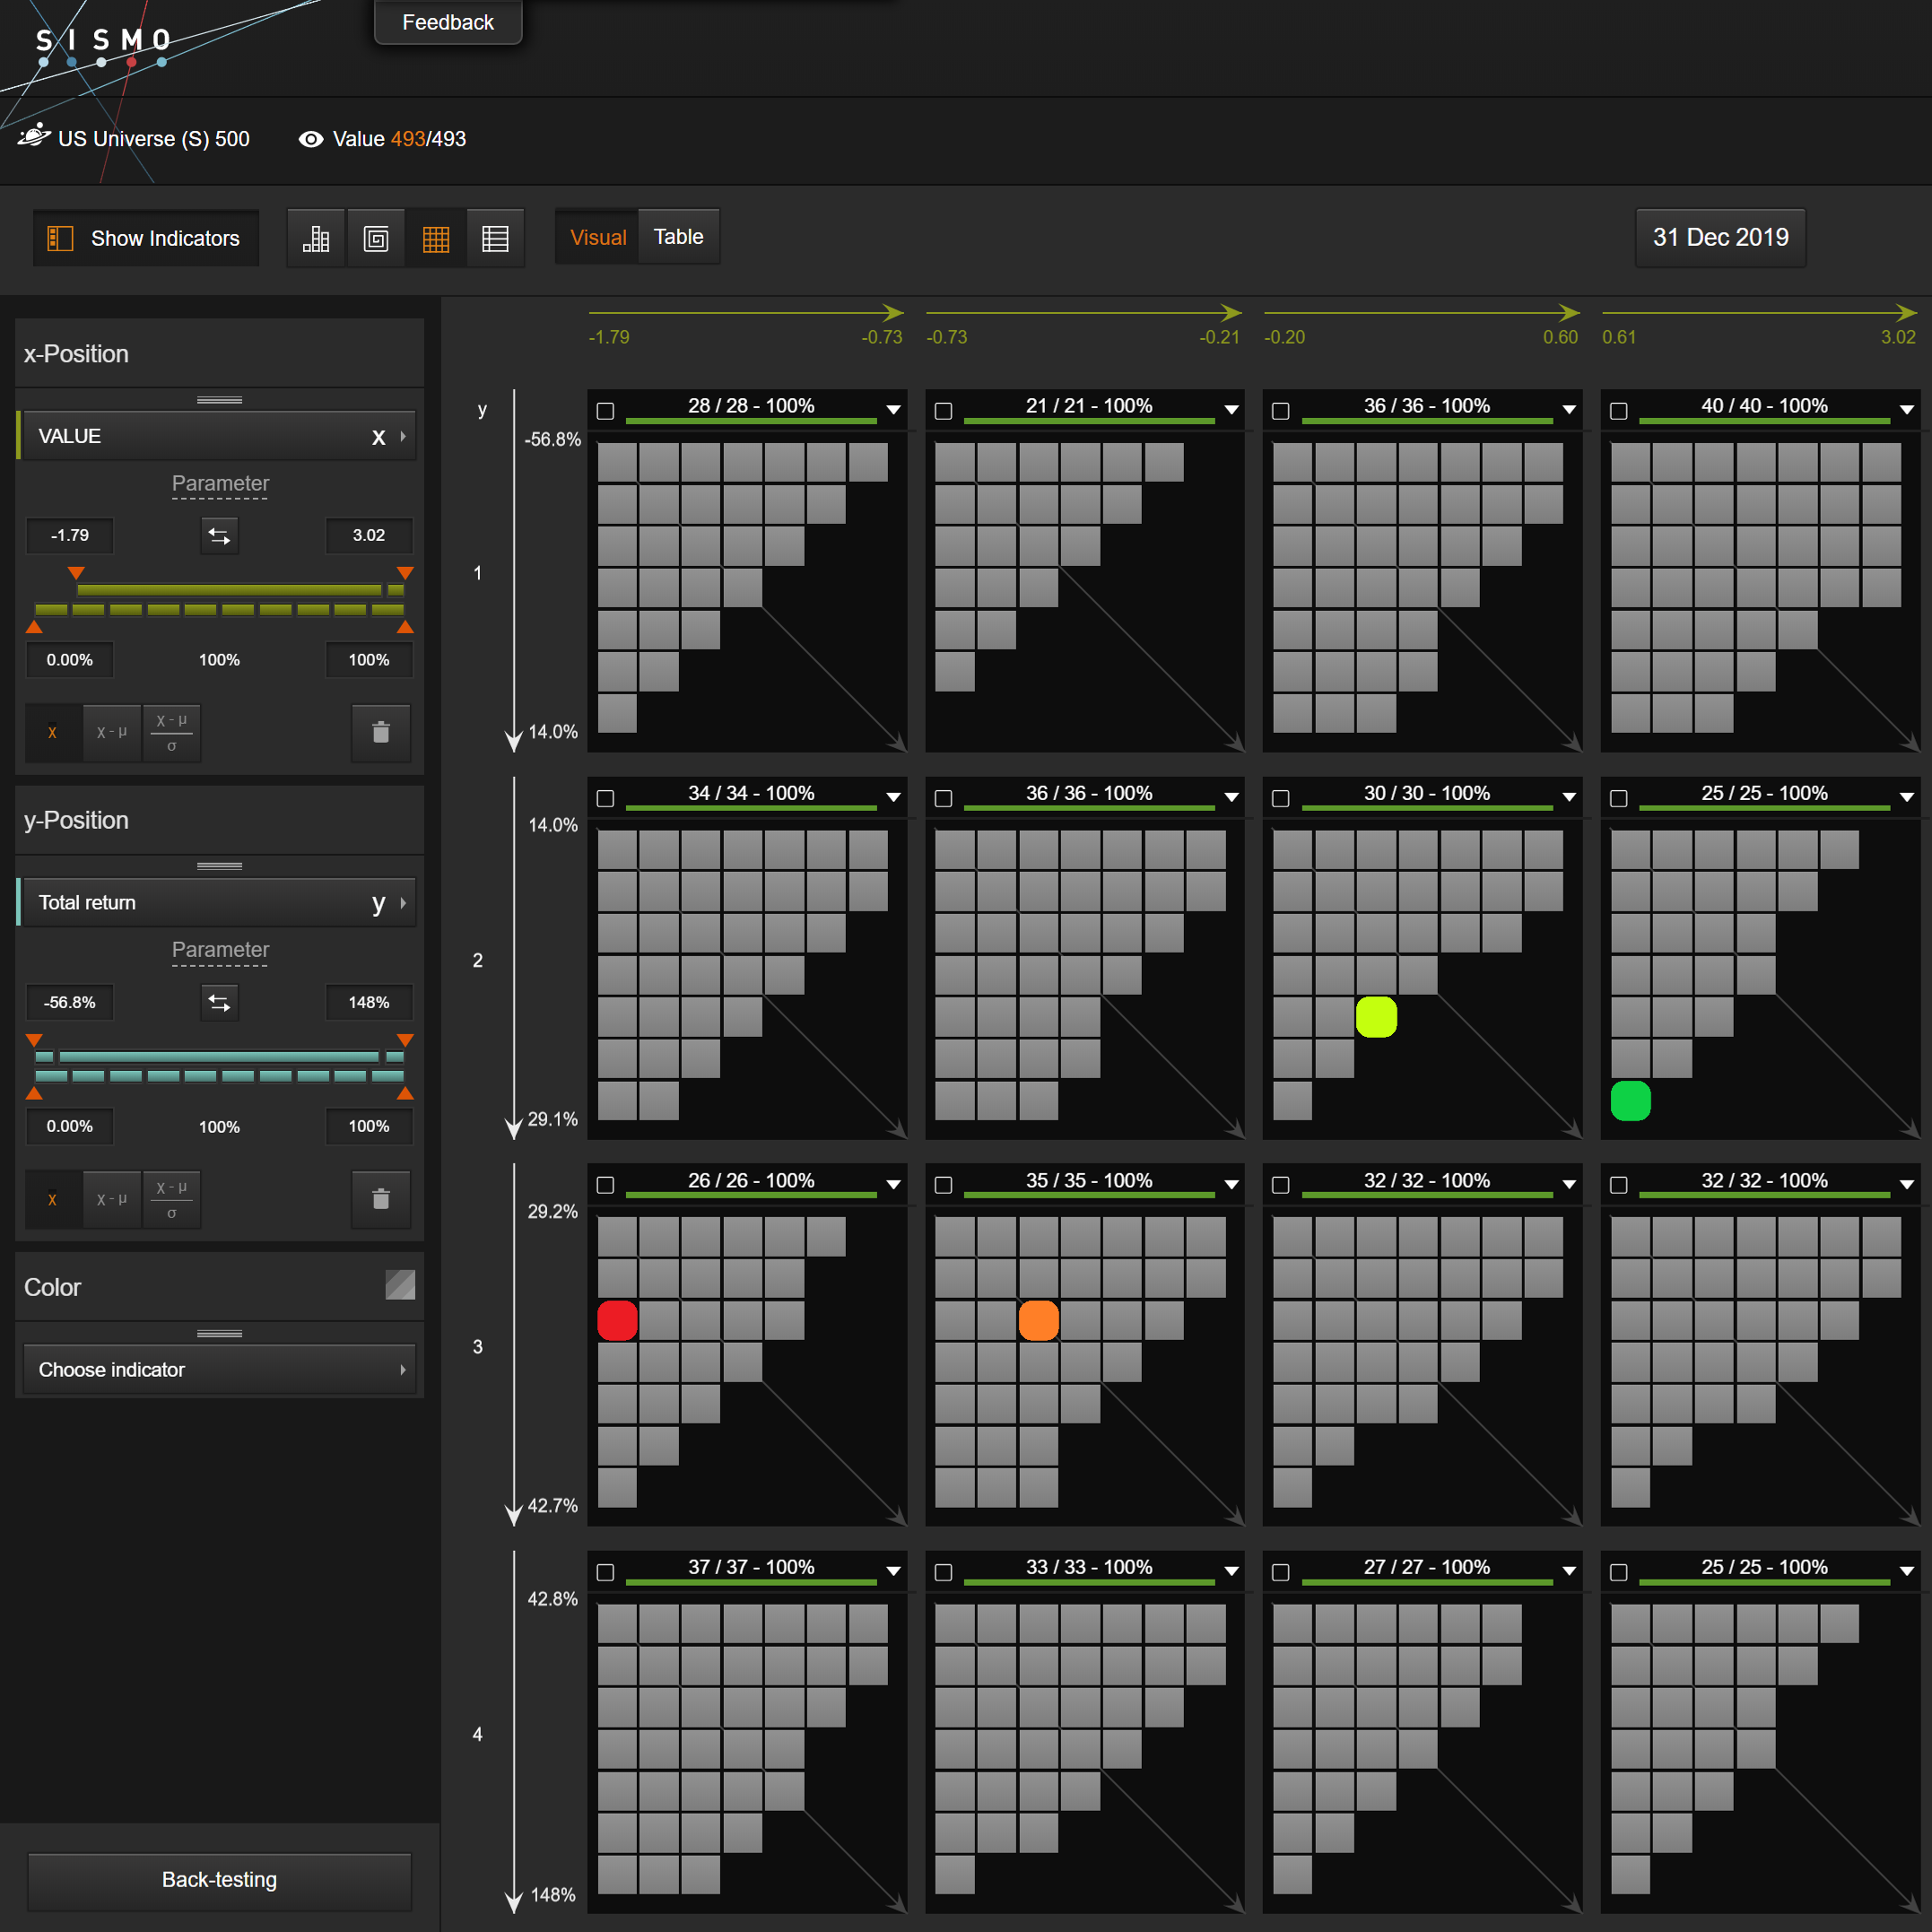

US : expensive stocks (Q1 and Q2) outperformed “cheap” stocks by 6-8%, confirming widespread belief that expensive stocks grew even more expensive. Among the best “expensive” performers are AMD (+243%), Chipotle (+94%) and obviously Apple (+89%)
Value Factor positioning vs 2019 performance – Europe universe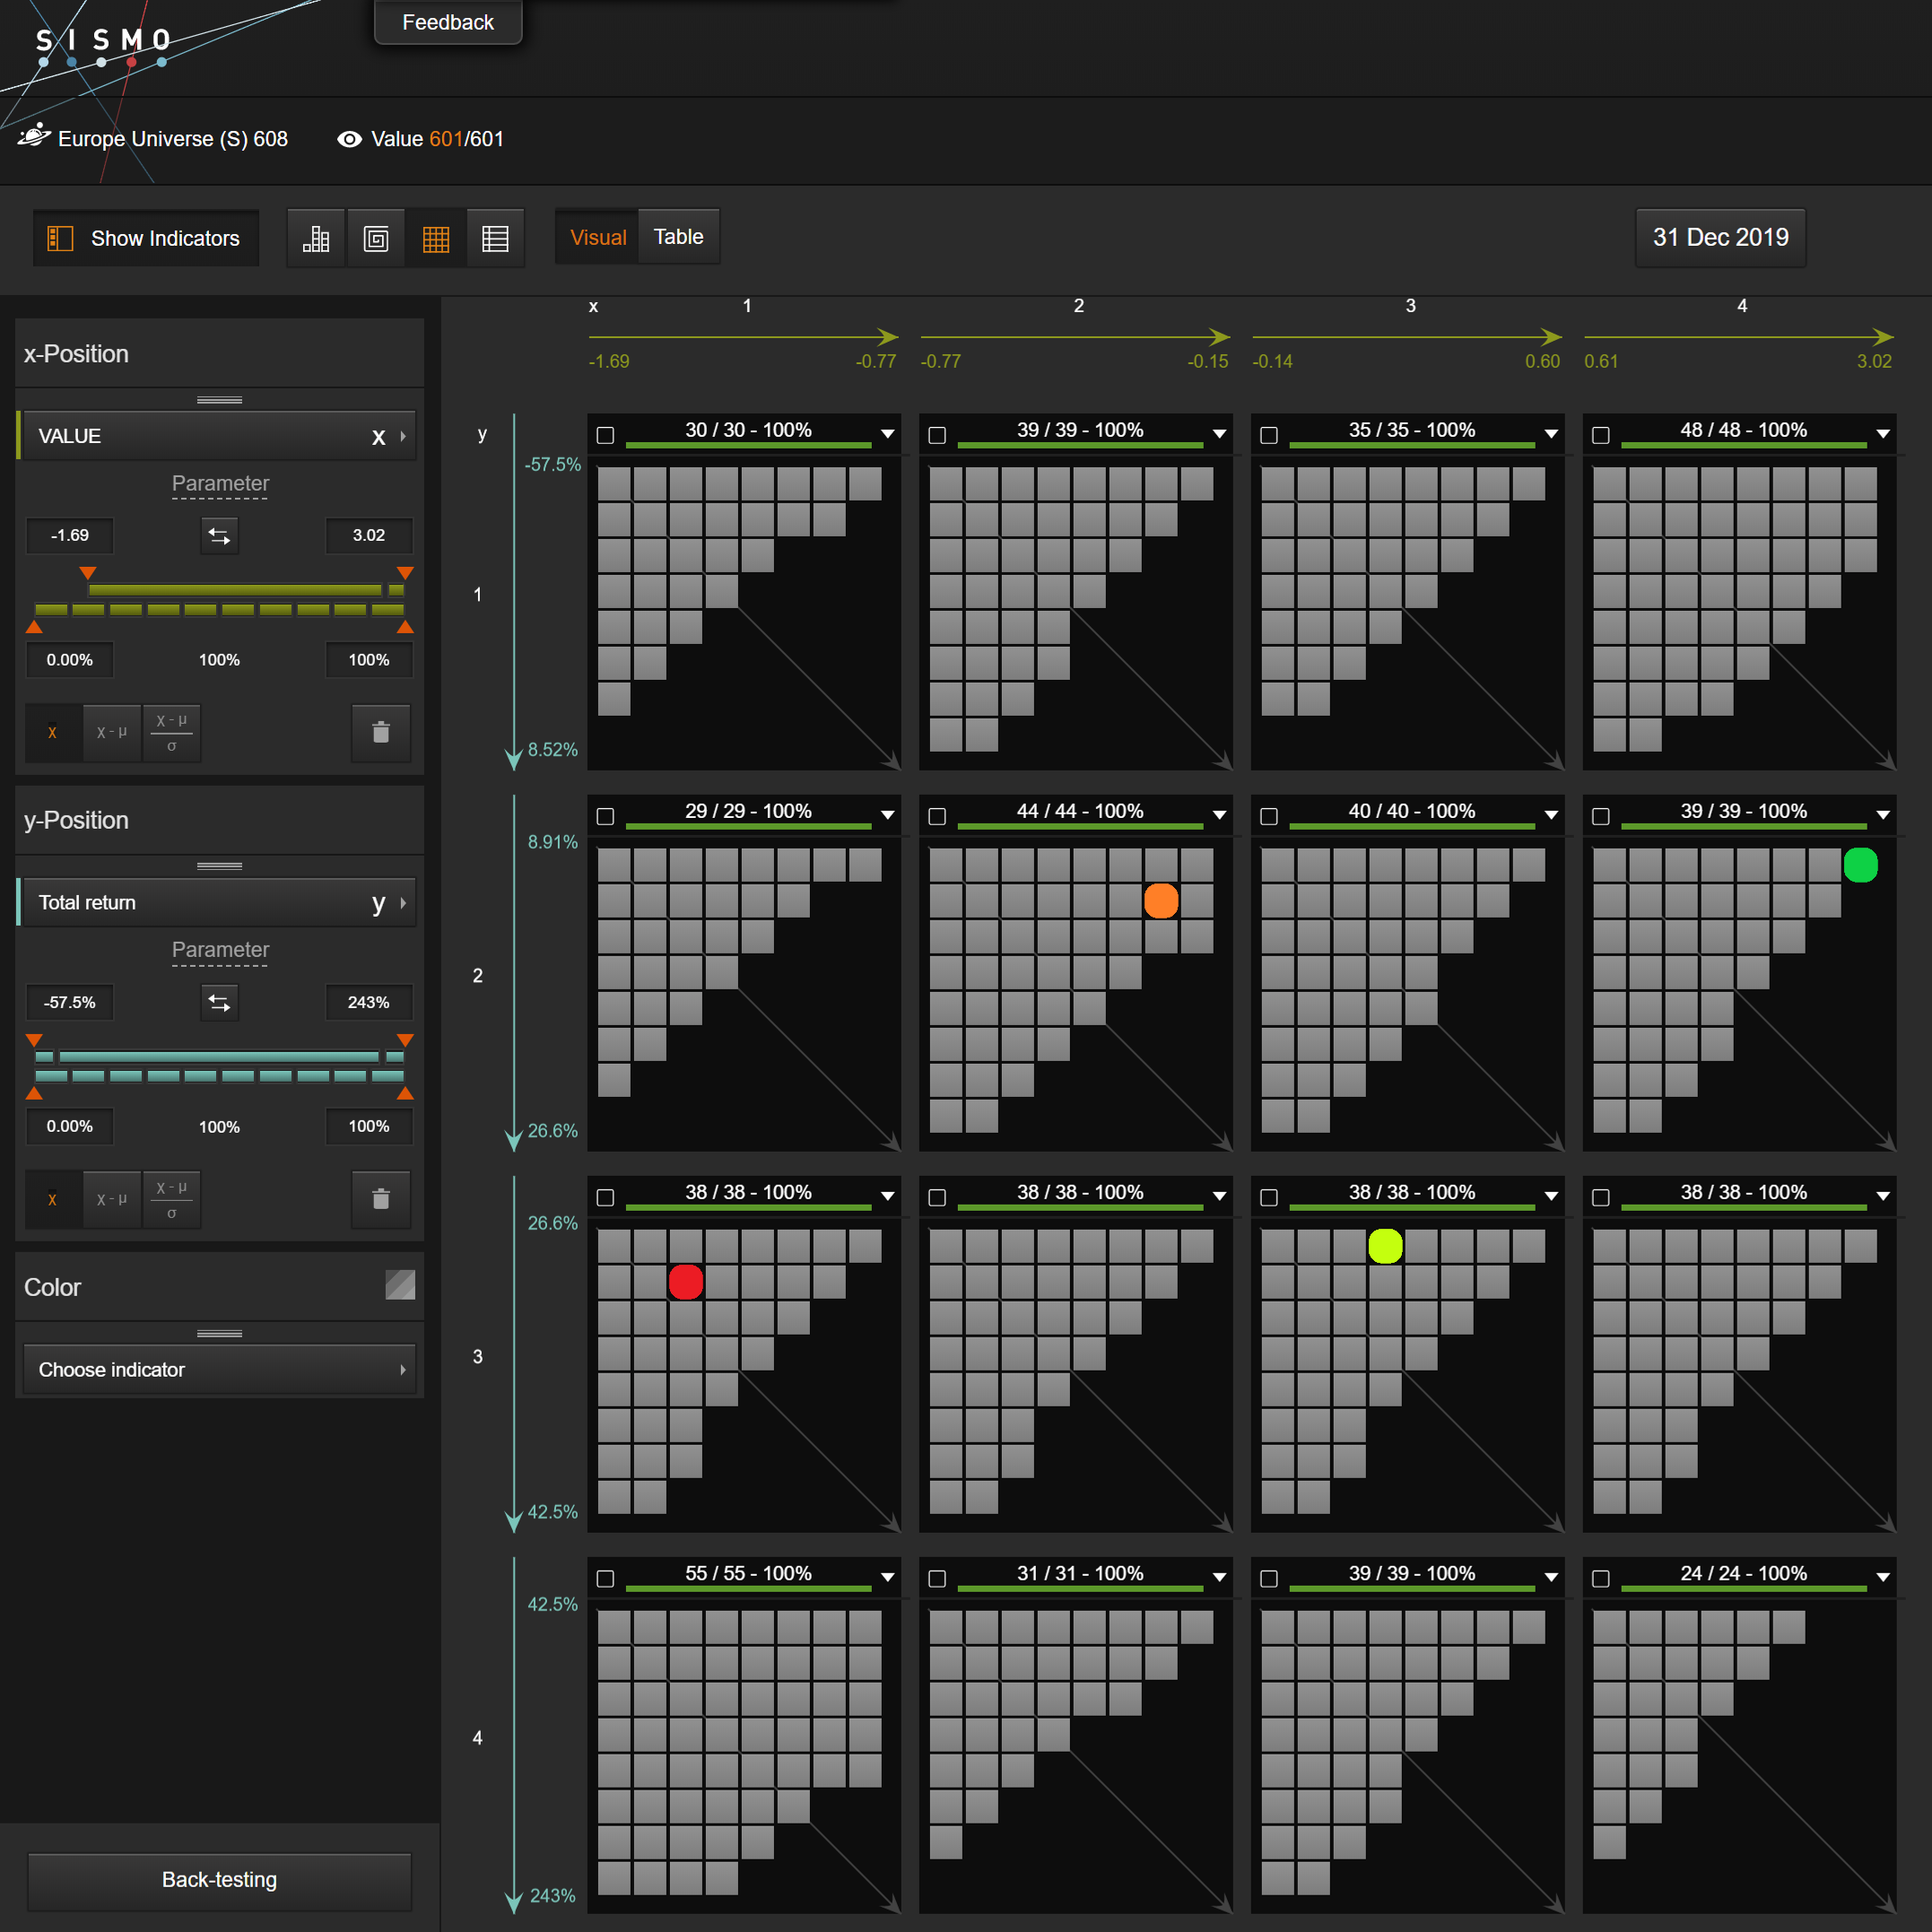
EU : expensive stocks (Q1) also outperformed other quartiles by a a wide margin (5-10%). Among the best “expensive” performers are Galapagos (+132%), ASML (+95.3%) and the LSE (93%).
Momentum Factor
Momentum is a measure of the recent price action over multiple time horizons.
Momentum Factor positioning vs 2019 performance – US universe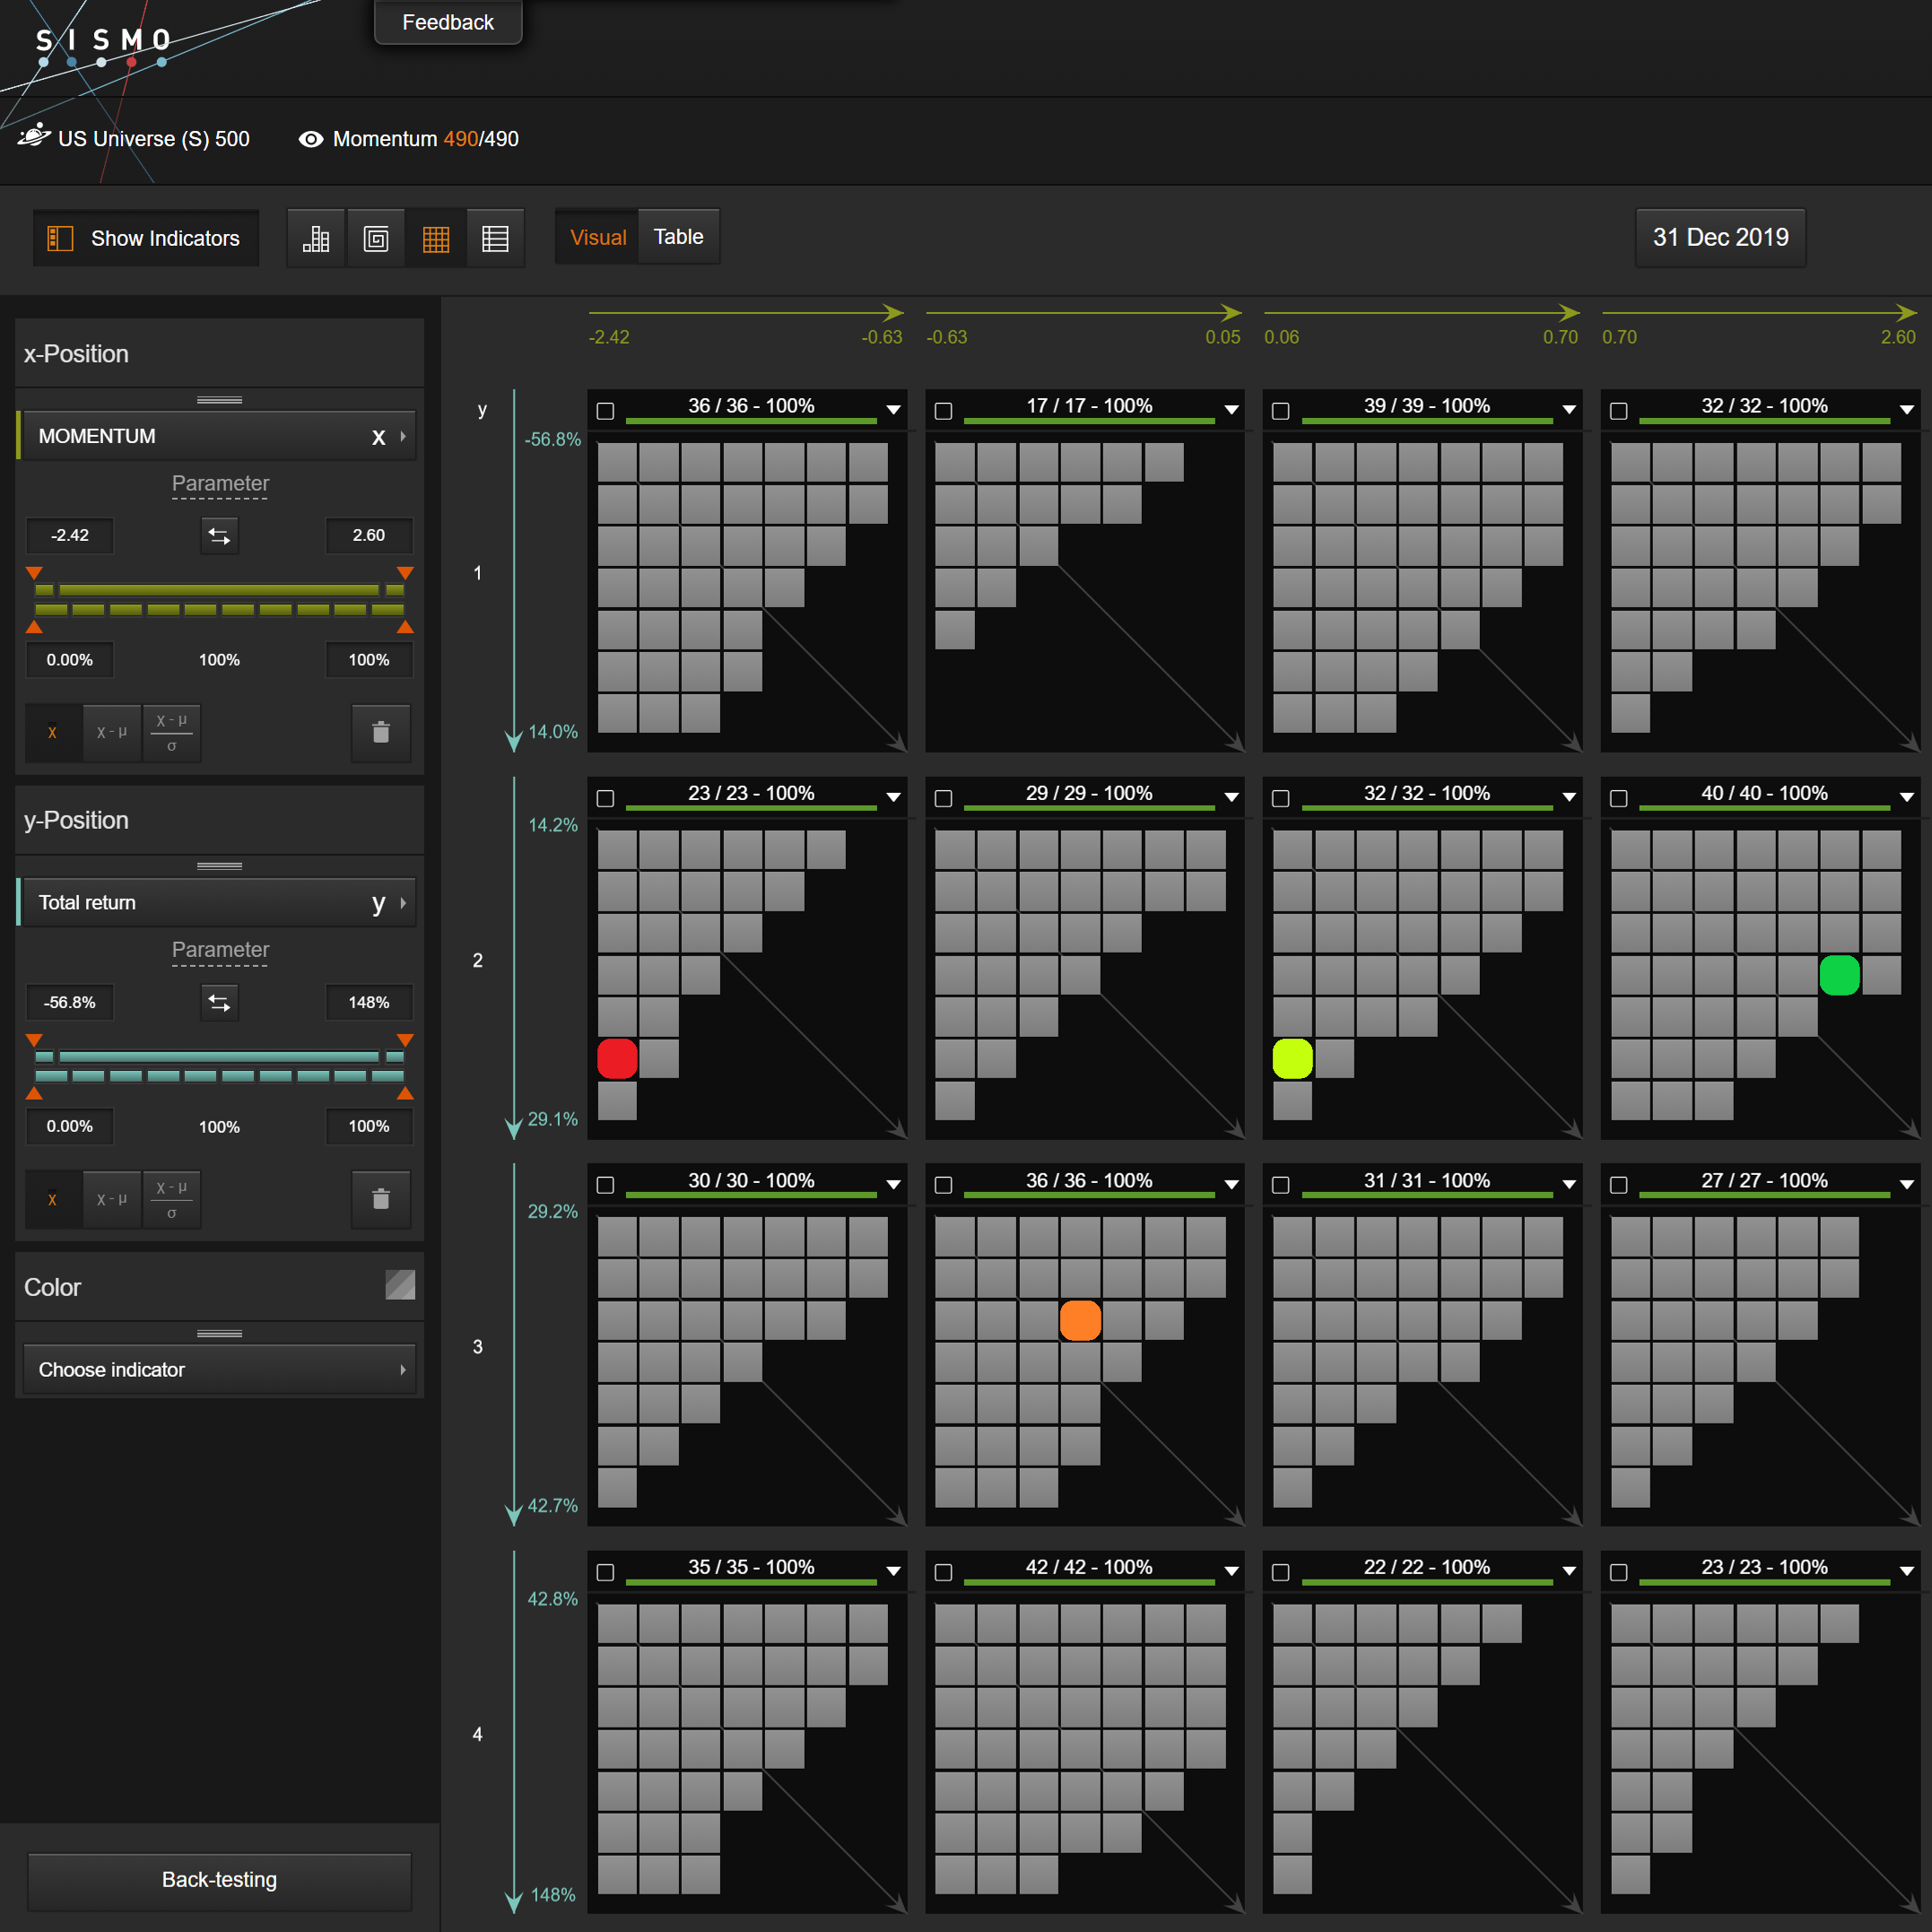
US : no clear pattern emerged in 2019. Q2 was the best performing quartile.
Momentum Factor positioning vs 2019 performance – Europe universe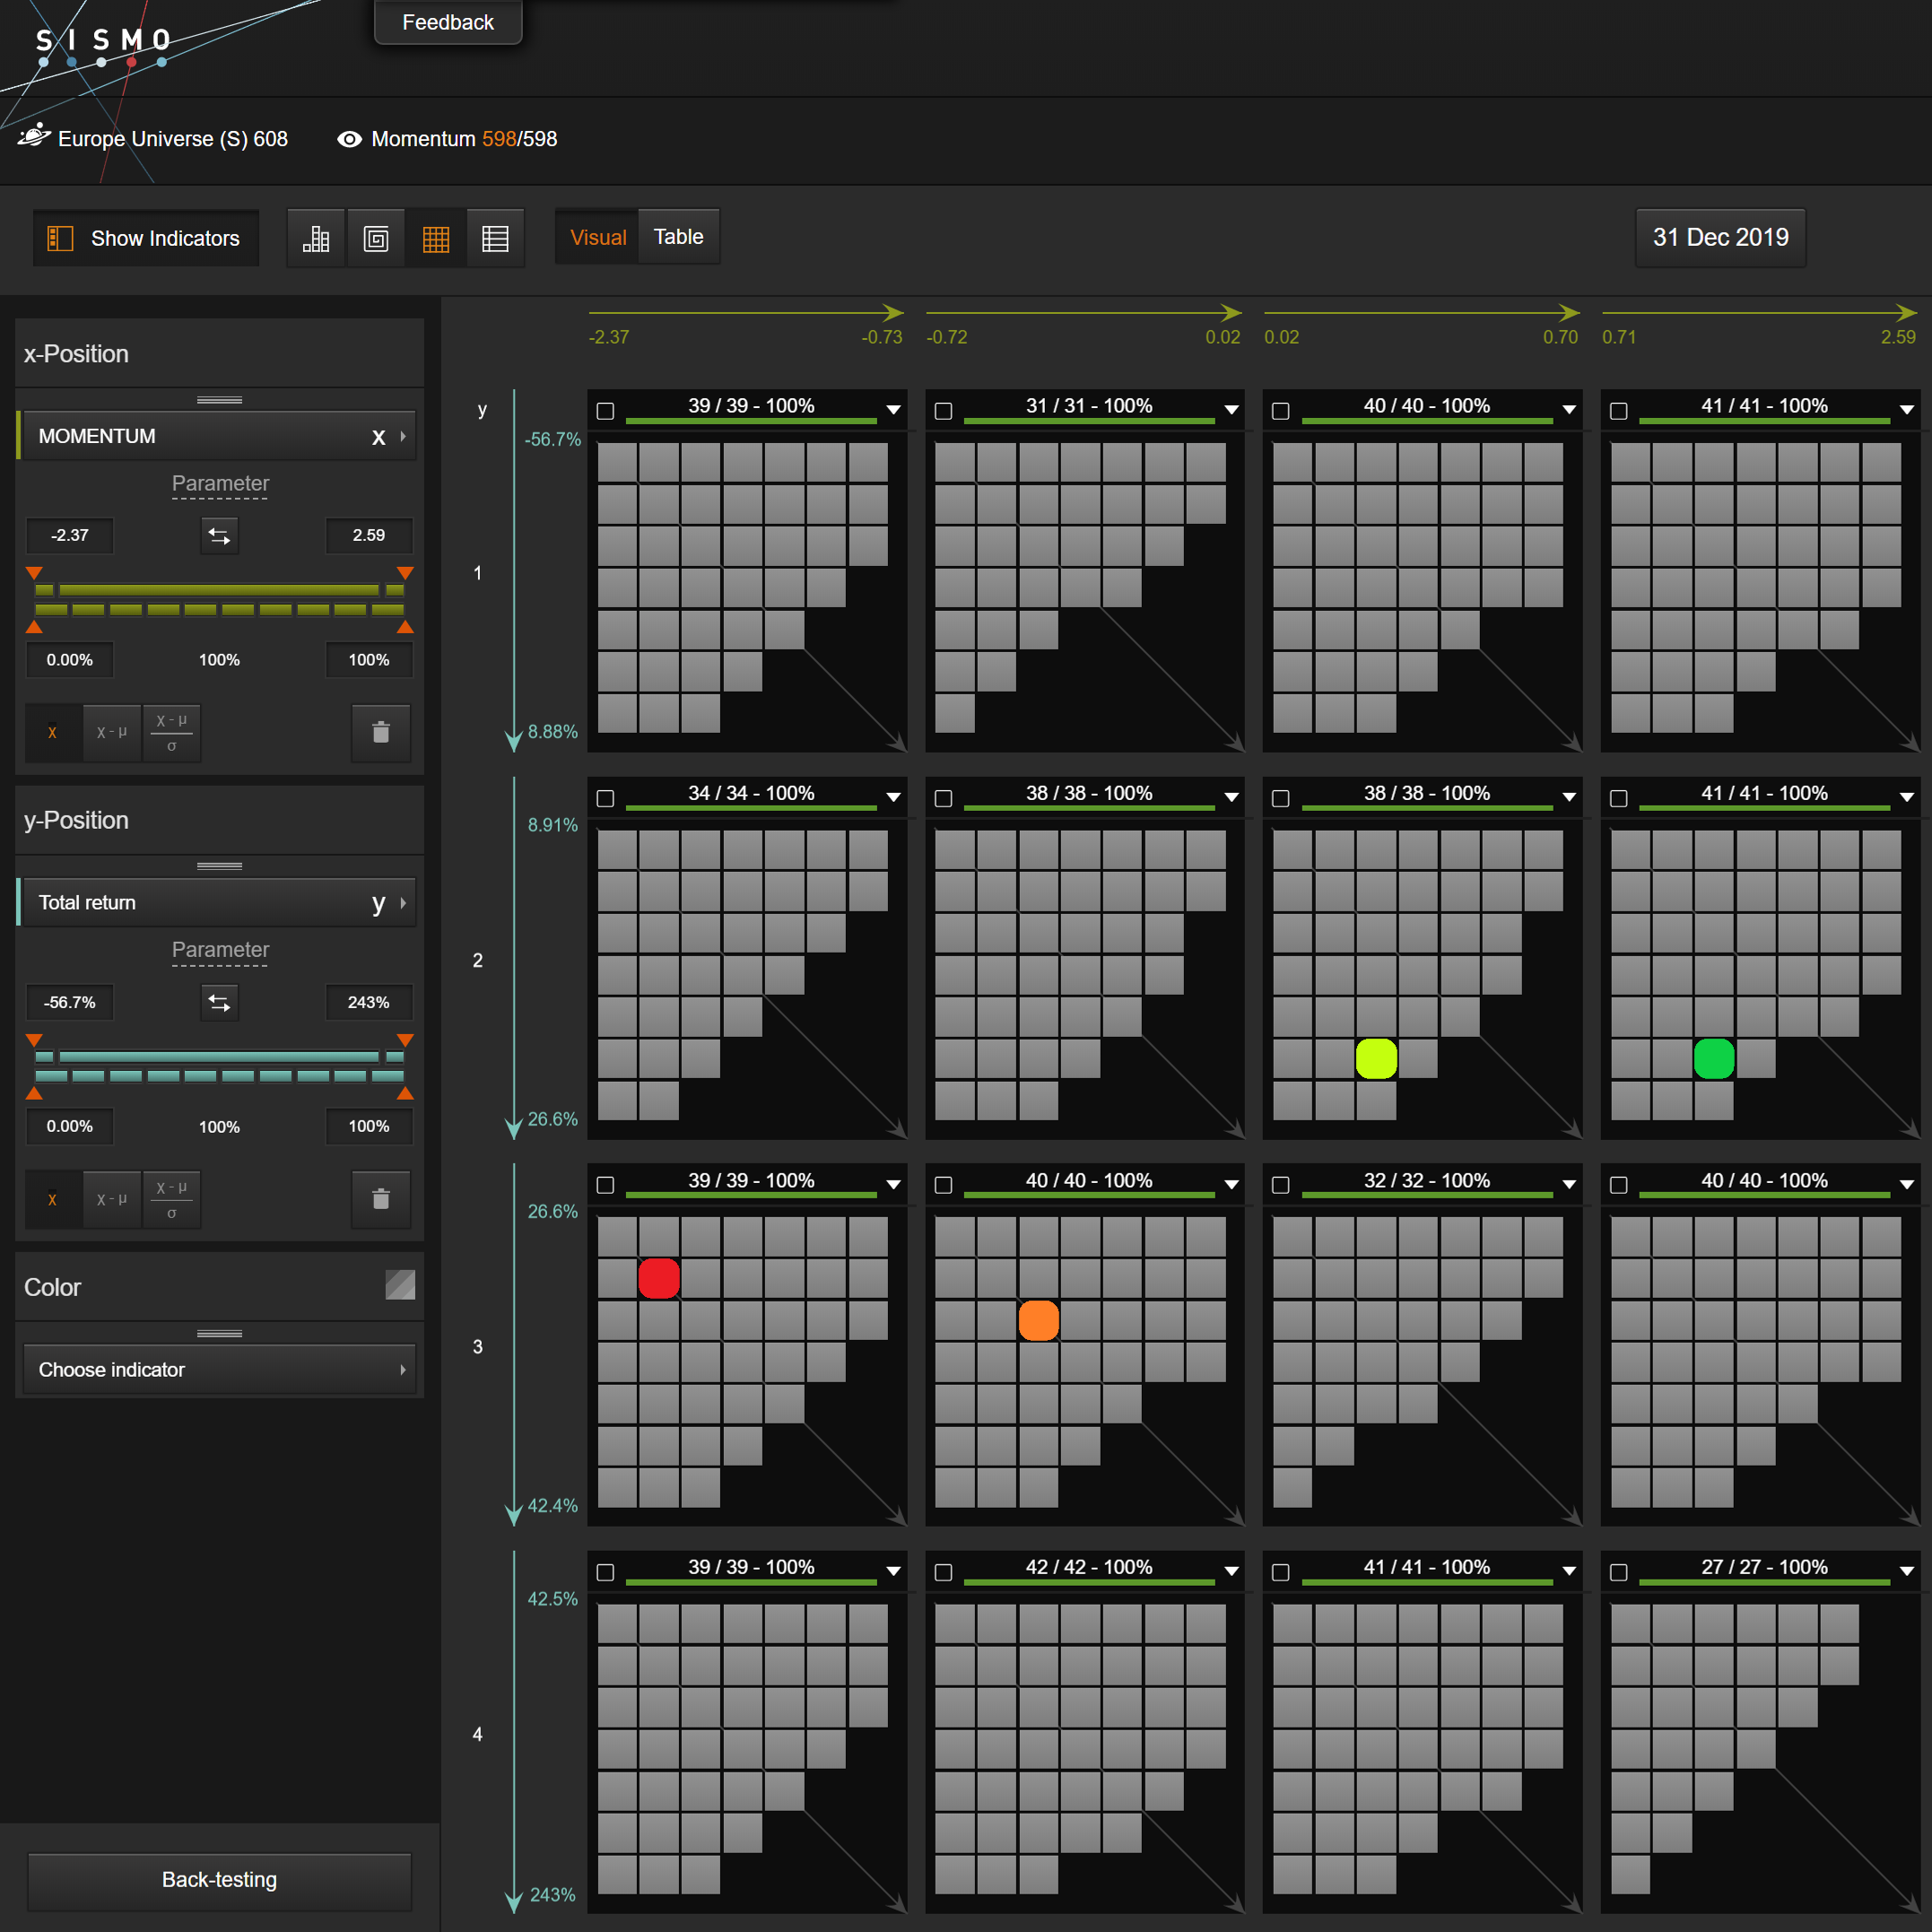
EU : 2019 was a reversal year in Europe as Q1 and Q2 stocks (mediocre or bad price action in 2018) outperformed Q3 and Q4 by 3-5% in 2019. Among the stocks with the most spectacular reversal in 2019 are Ingenico, ST Micro, and Amundi. We can get visual confirmation by displaying the price of these stocks in a Sismo Line chart for the period 2018-2019.
Performance of Ingenico, STM and Amundi over the period 2018-2019 (rebased at 100 on Dec 29th 2017)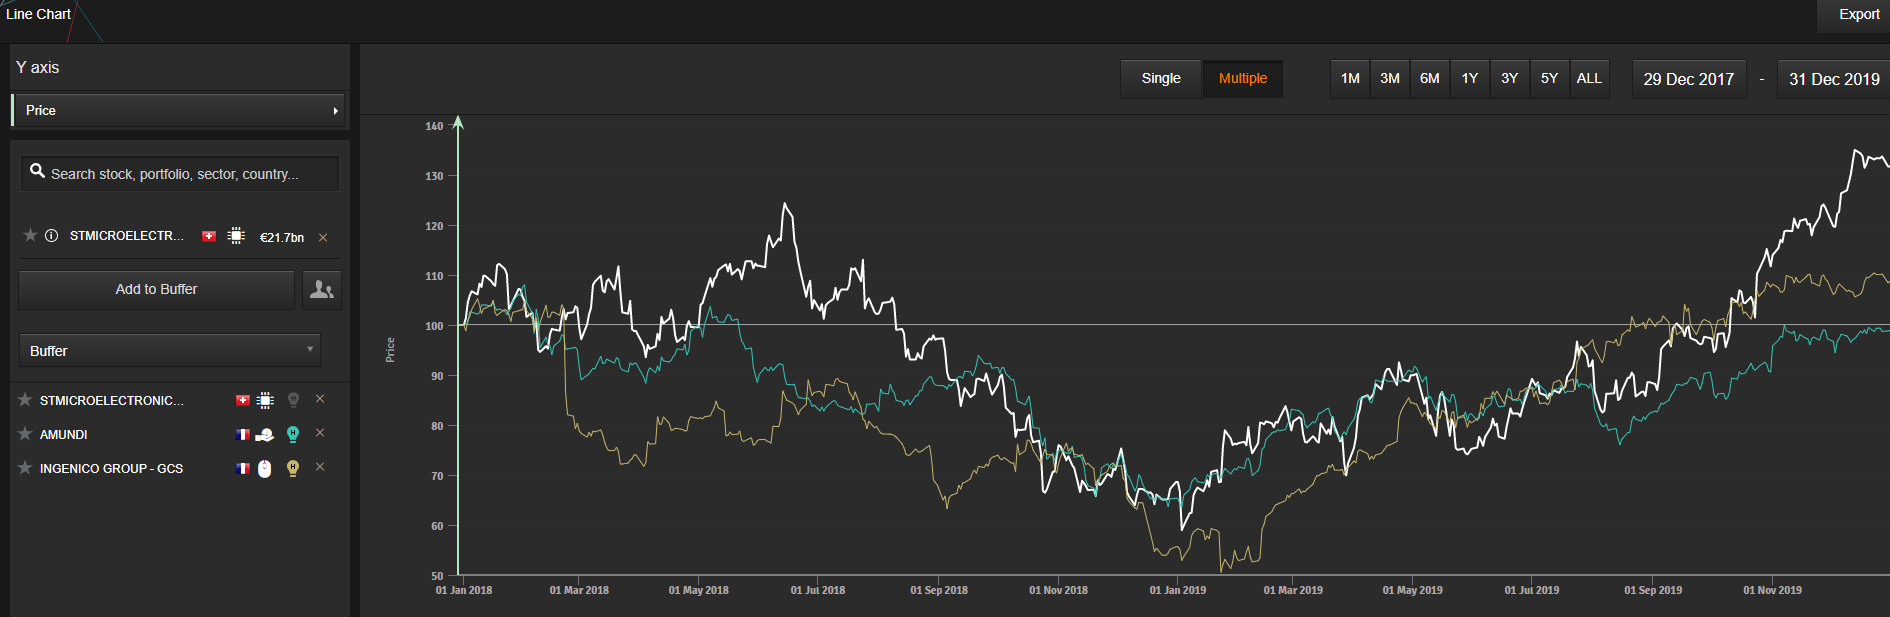
Sentiment Factor
Companies with high Sentiment are attractive according to sell-side consensus.
Sentiment Factor positioning vs 2019 performance – US universe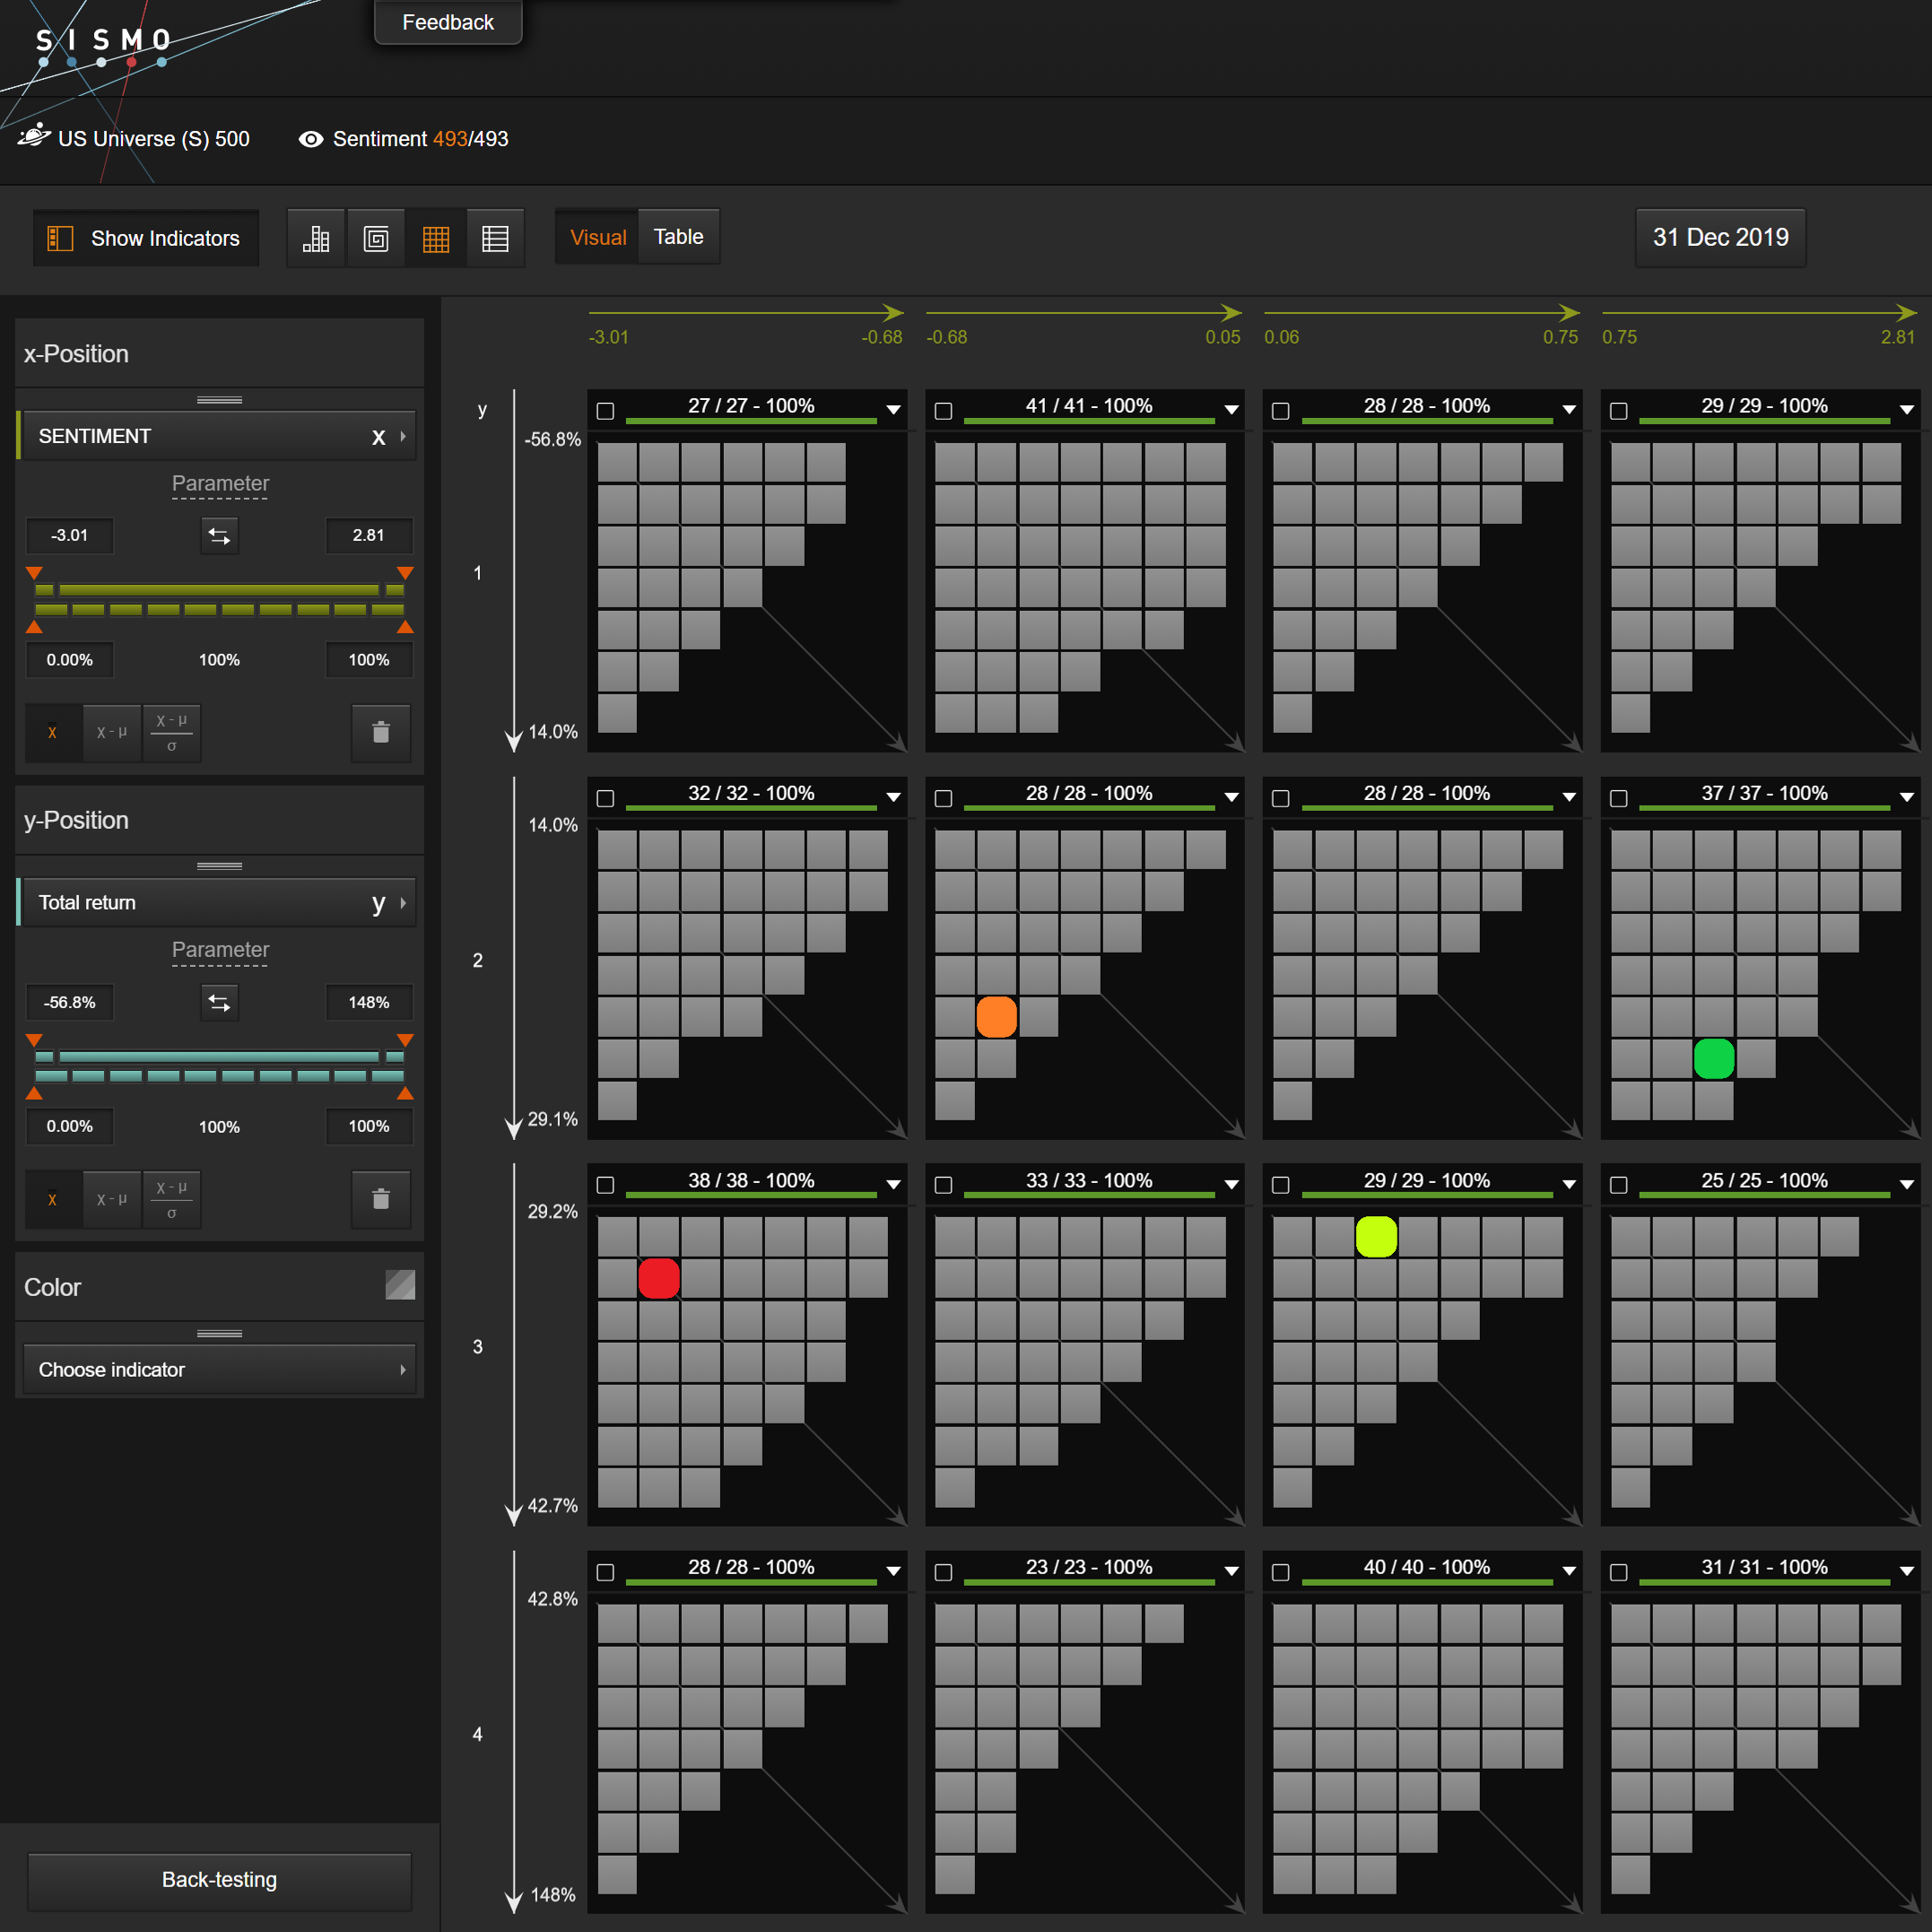
US : there was no clear pattern. Stocks with highly positive Sentiment (Q4) did not outperform.
Sentiment Factor positioning vs 2019 performance – Europe universe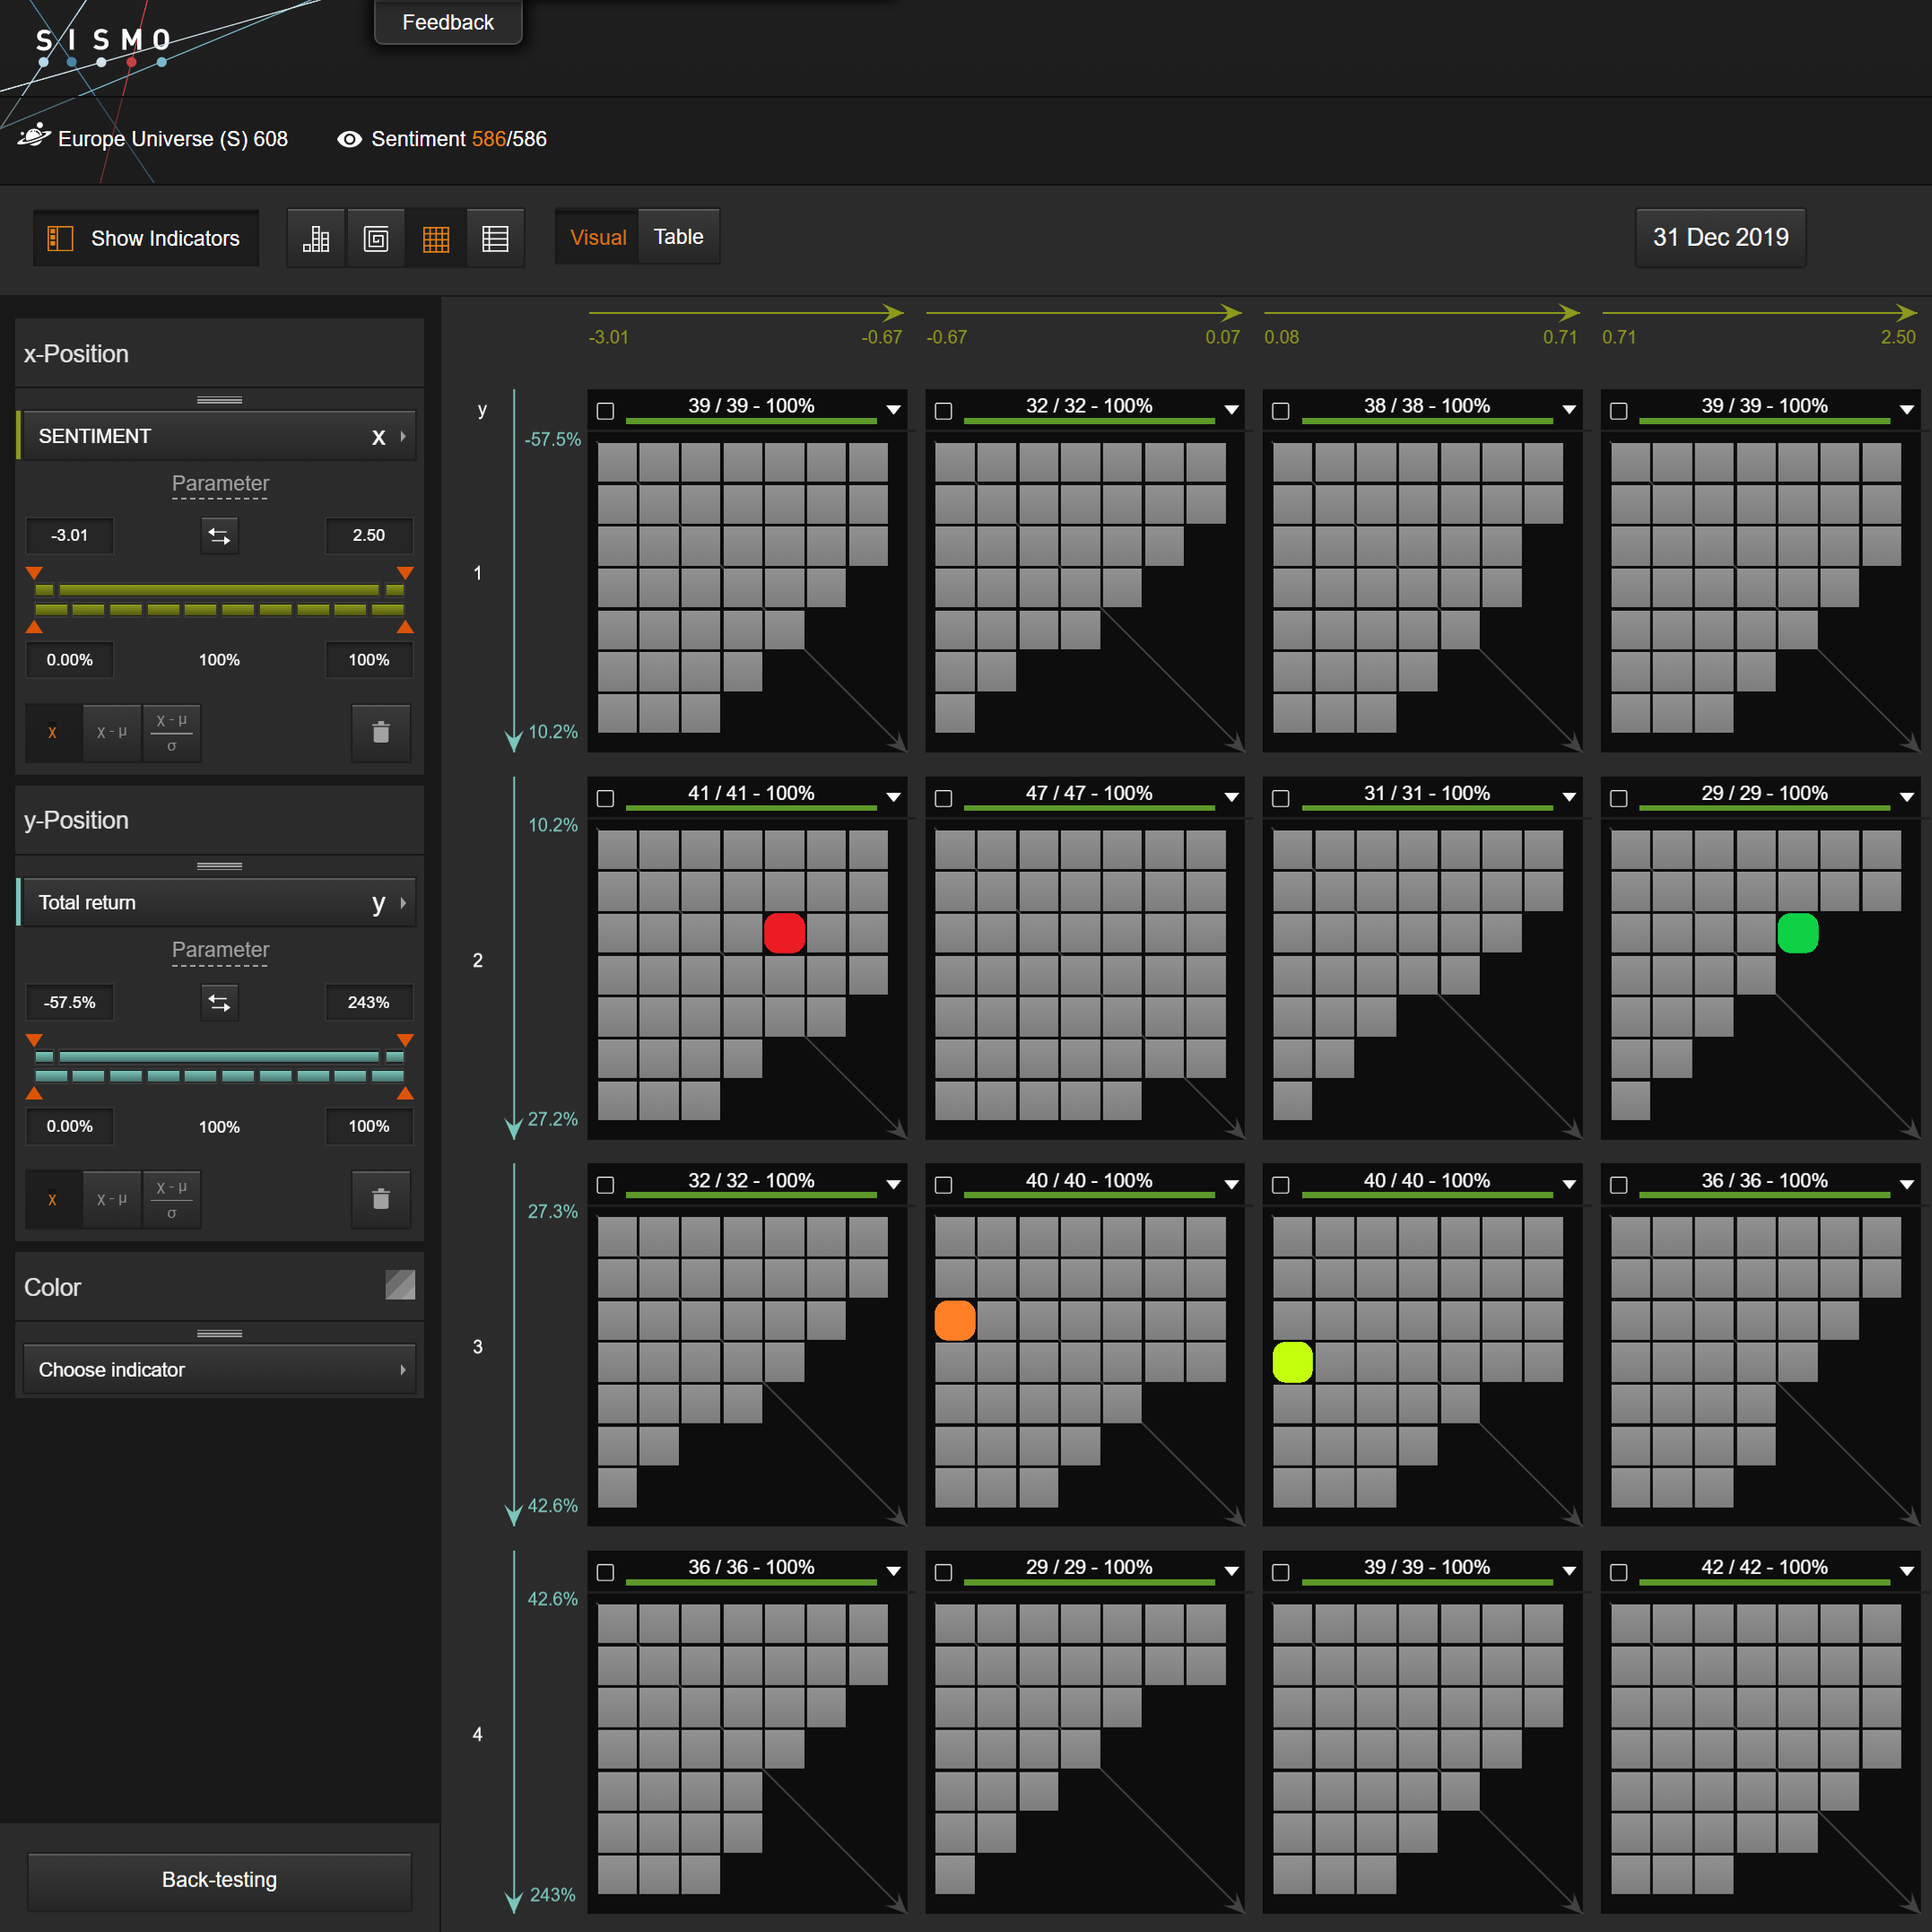
EU : there was no clear pattern. Stocks with highly positive Sentiment (Q4) did not outperform.
Risk Factor
This Factor combines risk indicators (beta, volatility and skewness) into one single Risk measure. Color code for Risk Quartiles is inverted (eg Q1 = low Risk = green).
Risk Factor positioning vs 2019 performance – US universe
US : there was no clear pattern. Q2 and Q3 (moderately risky stocks) outperformed both Q1 and Q4 stocks.
Risk Factor positioning vs 2019 performance – Europe universe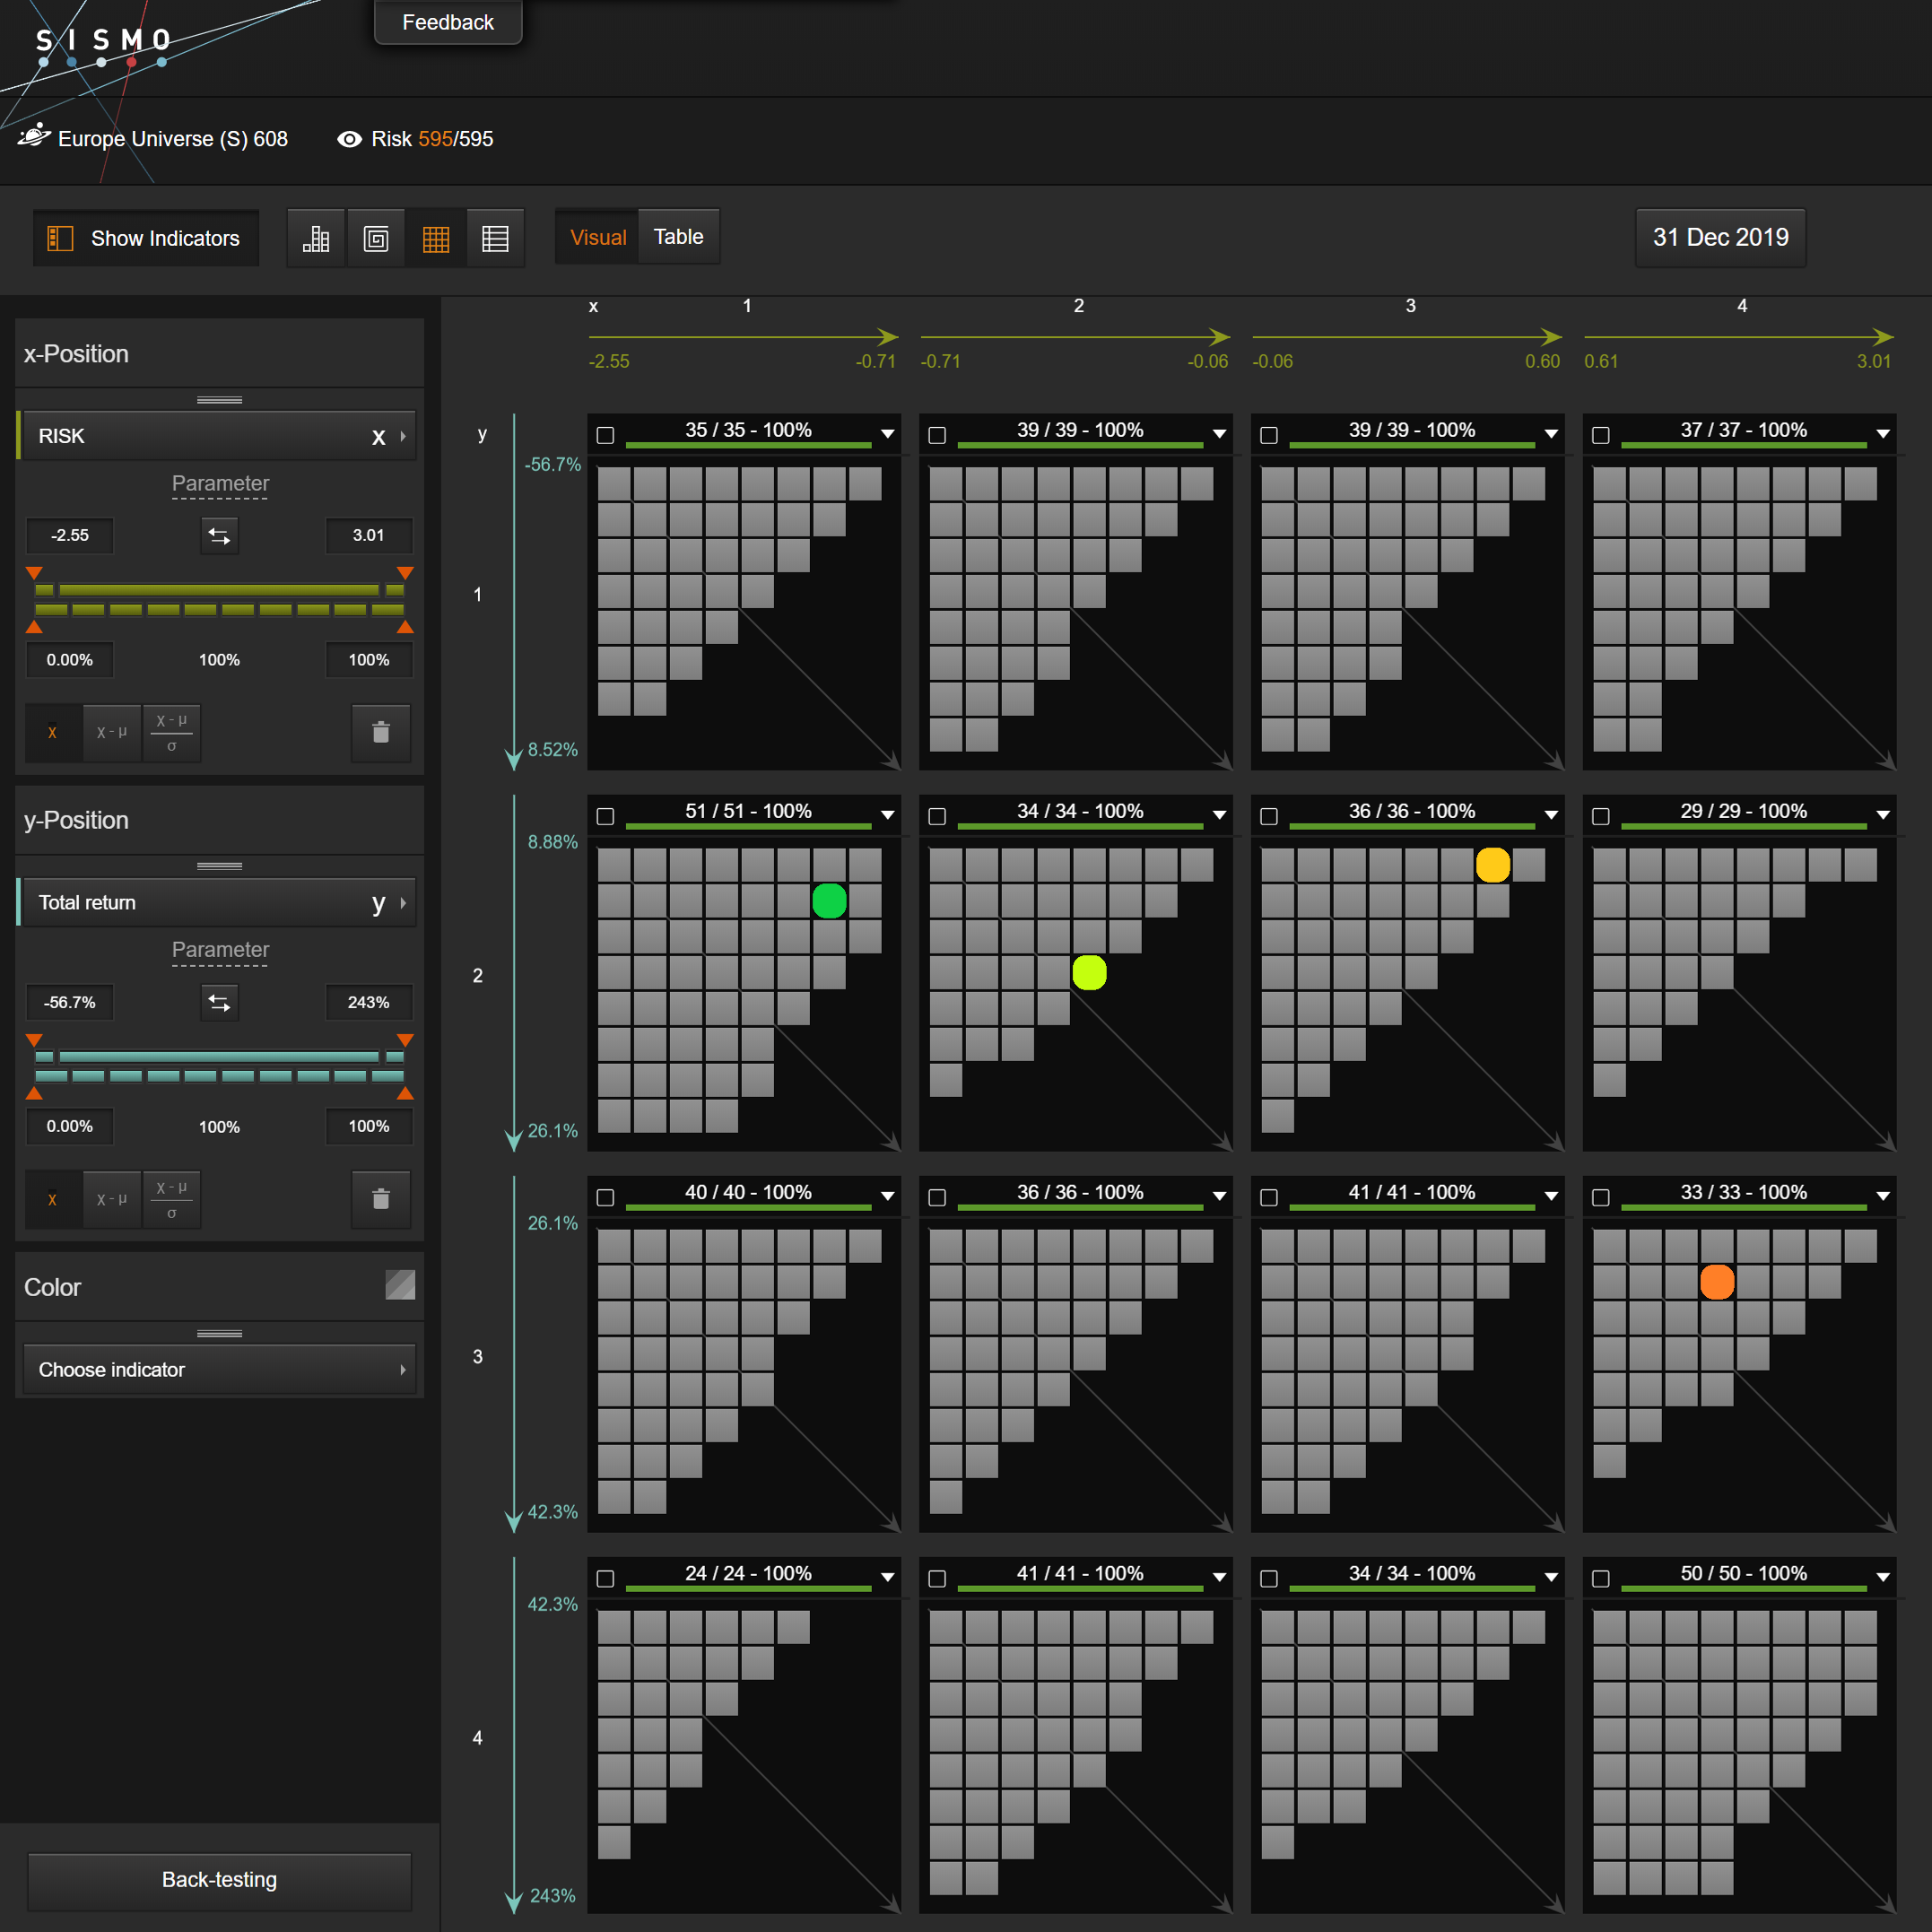
EU : 2019 was definitely a “risk-on” year with the riskiest (Q4) stocks outperforming other quartiles by 7 to 10%. Among the riskiest best performers are JD Sports (+141%), Amplifon (+83.8%) and Ferrari (+67%).
Size Factor
This Factor uses market cap as a proxy for the Size of a company.
Size Factor positioning vs 2019 performance – US universe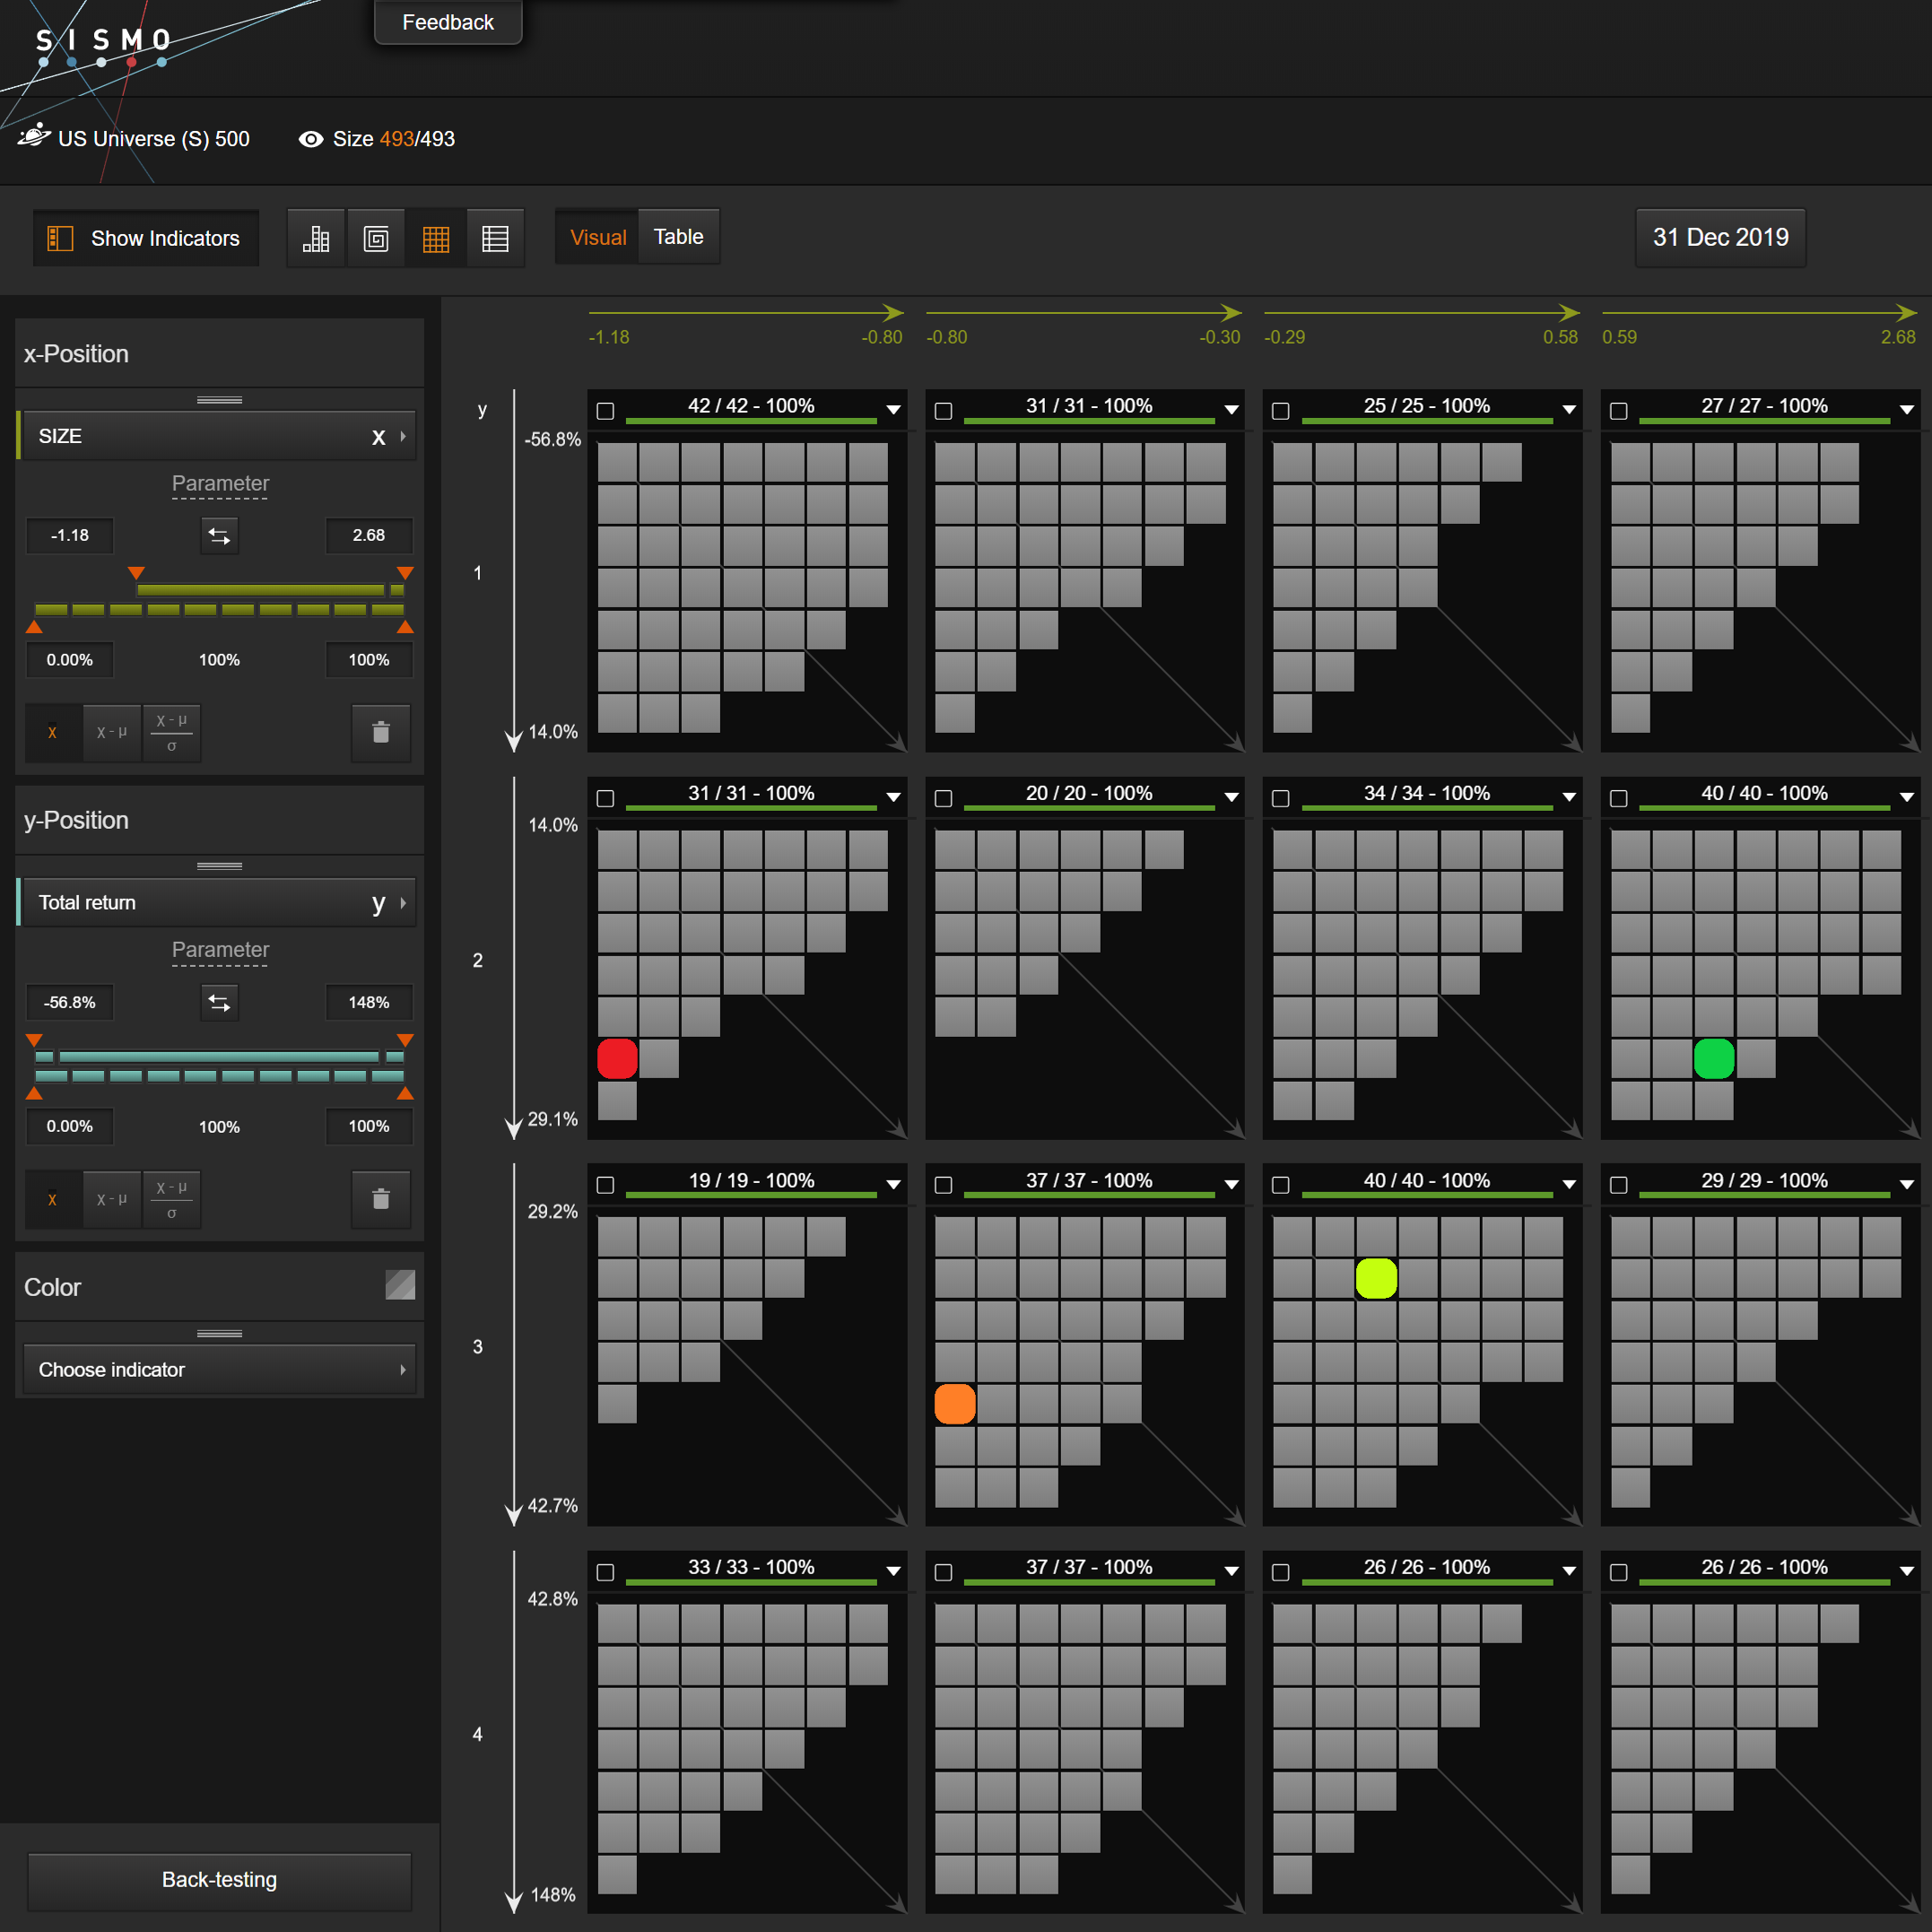
US : there was no very clear pattern as mid-sized companies outperformed both large and small ones.
Size Factor positioning vs 2019 performance – Europe universe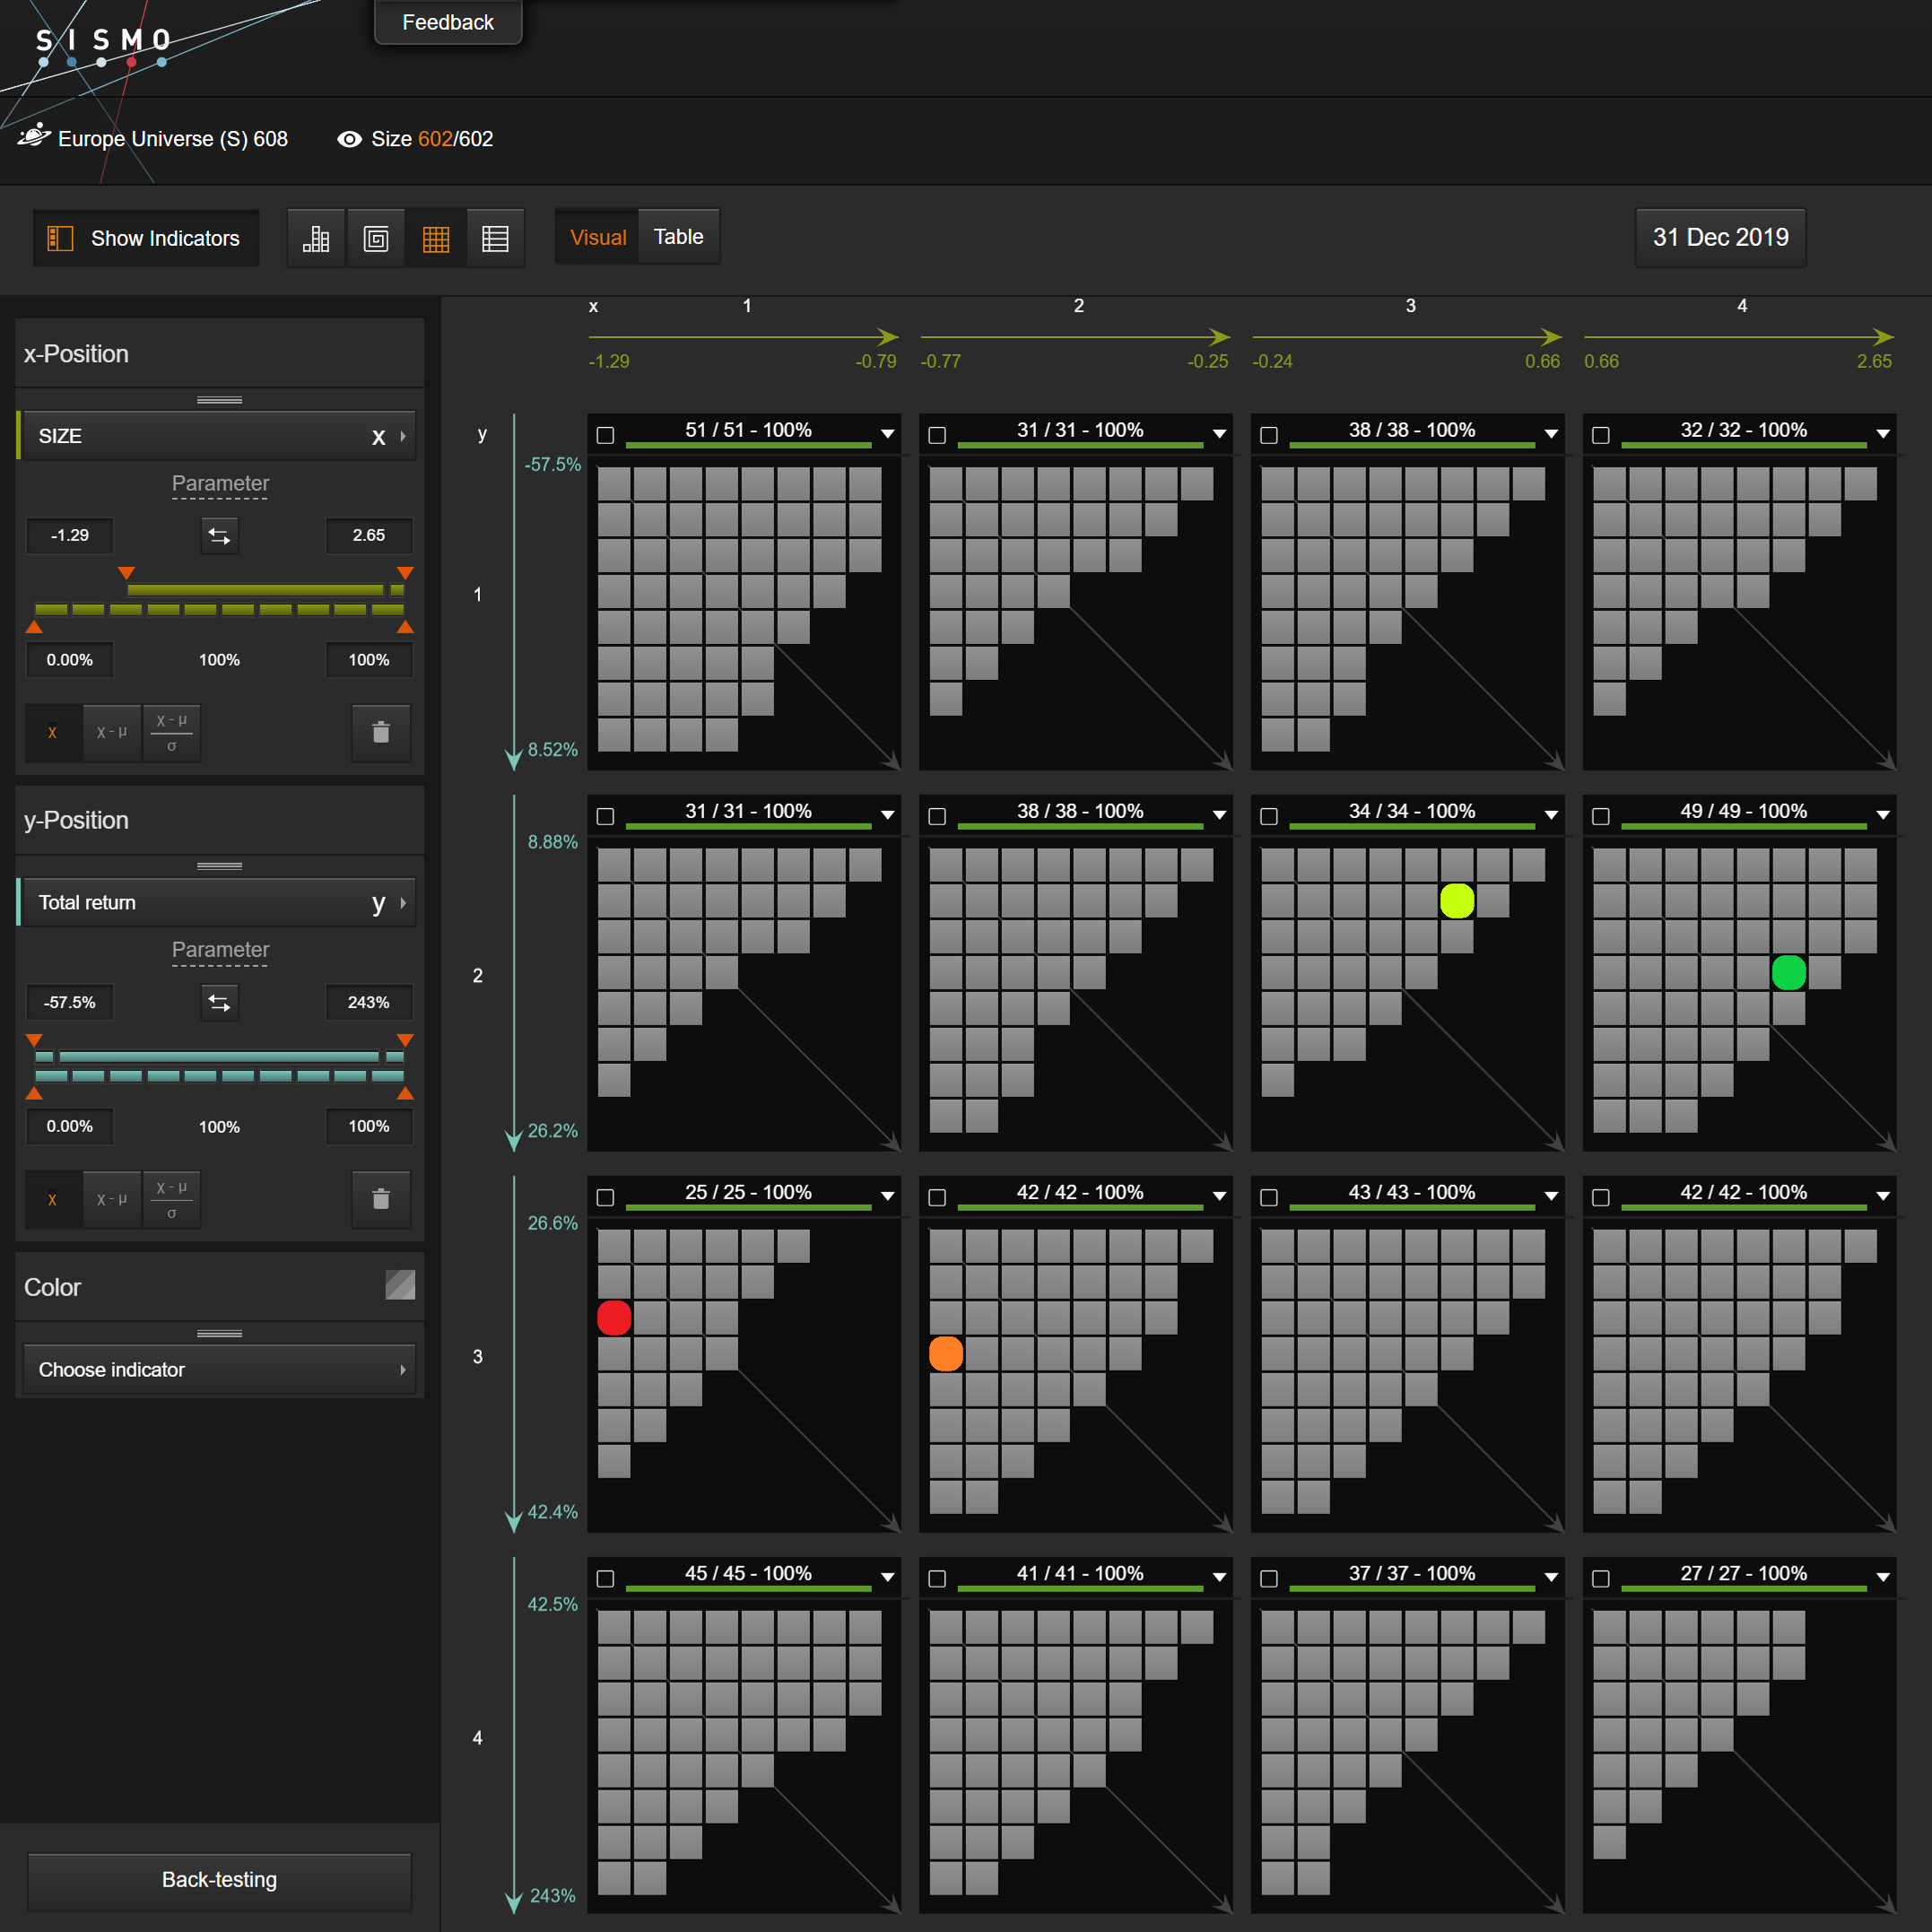
EU : small companies (Q1 and Q2) outperformed larged ones by 3-5%. Among the best “small” performers are Cellnex (+94.9%), Aveva (+94.9%) and Banco Mediolanum (+83.8%).
Quality Factor
High Quality companies tend to deliver regular profits with a healthy balance sheet.
Quality Factor positioning vs 2019 performance – US universe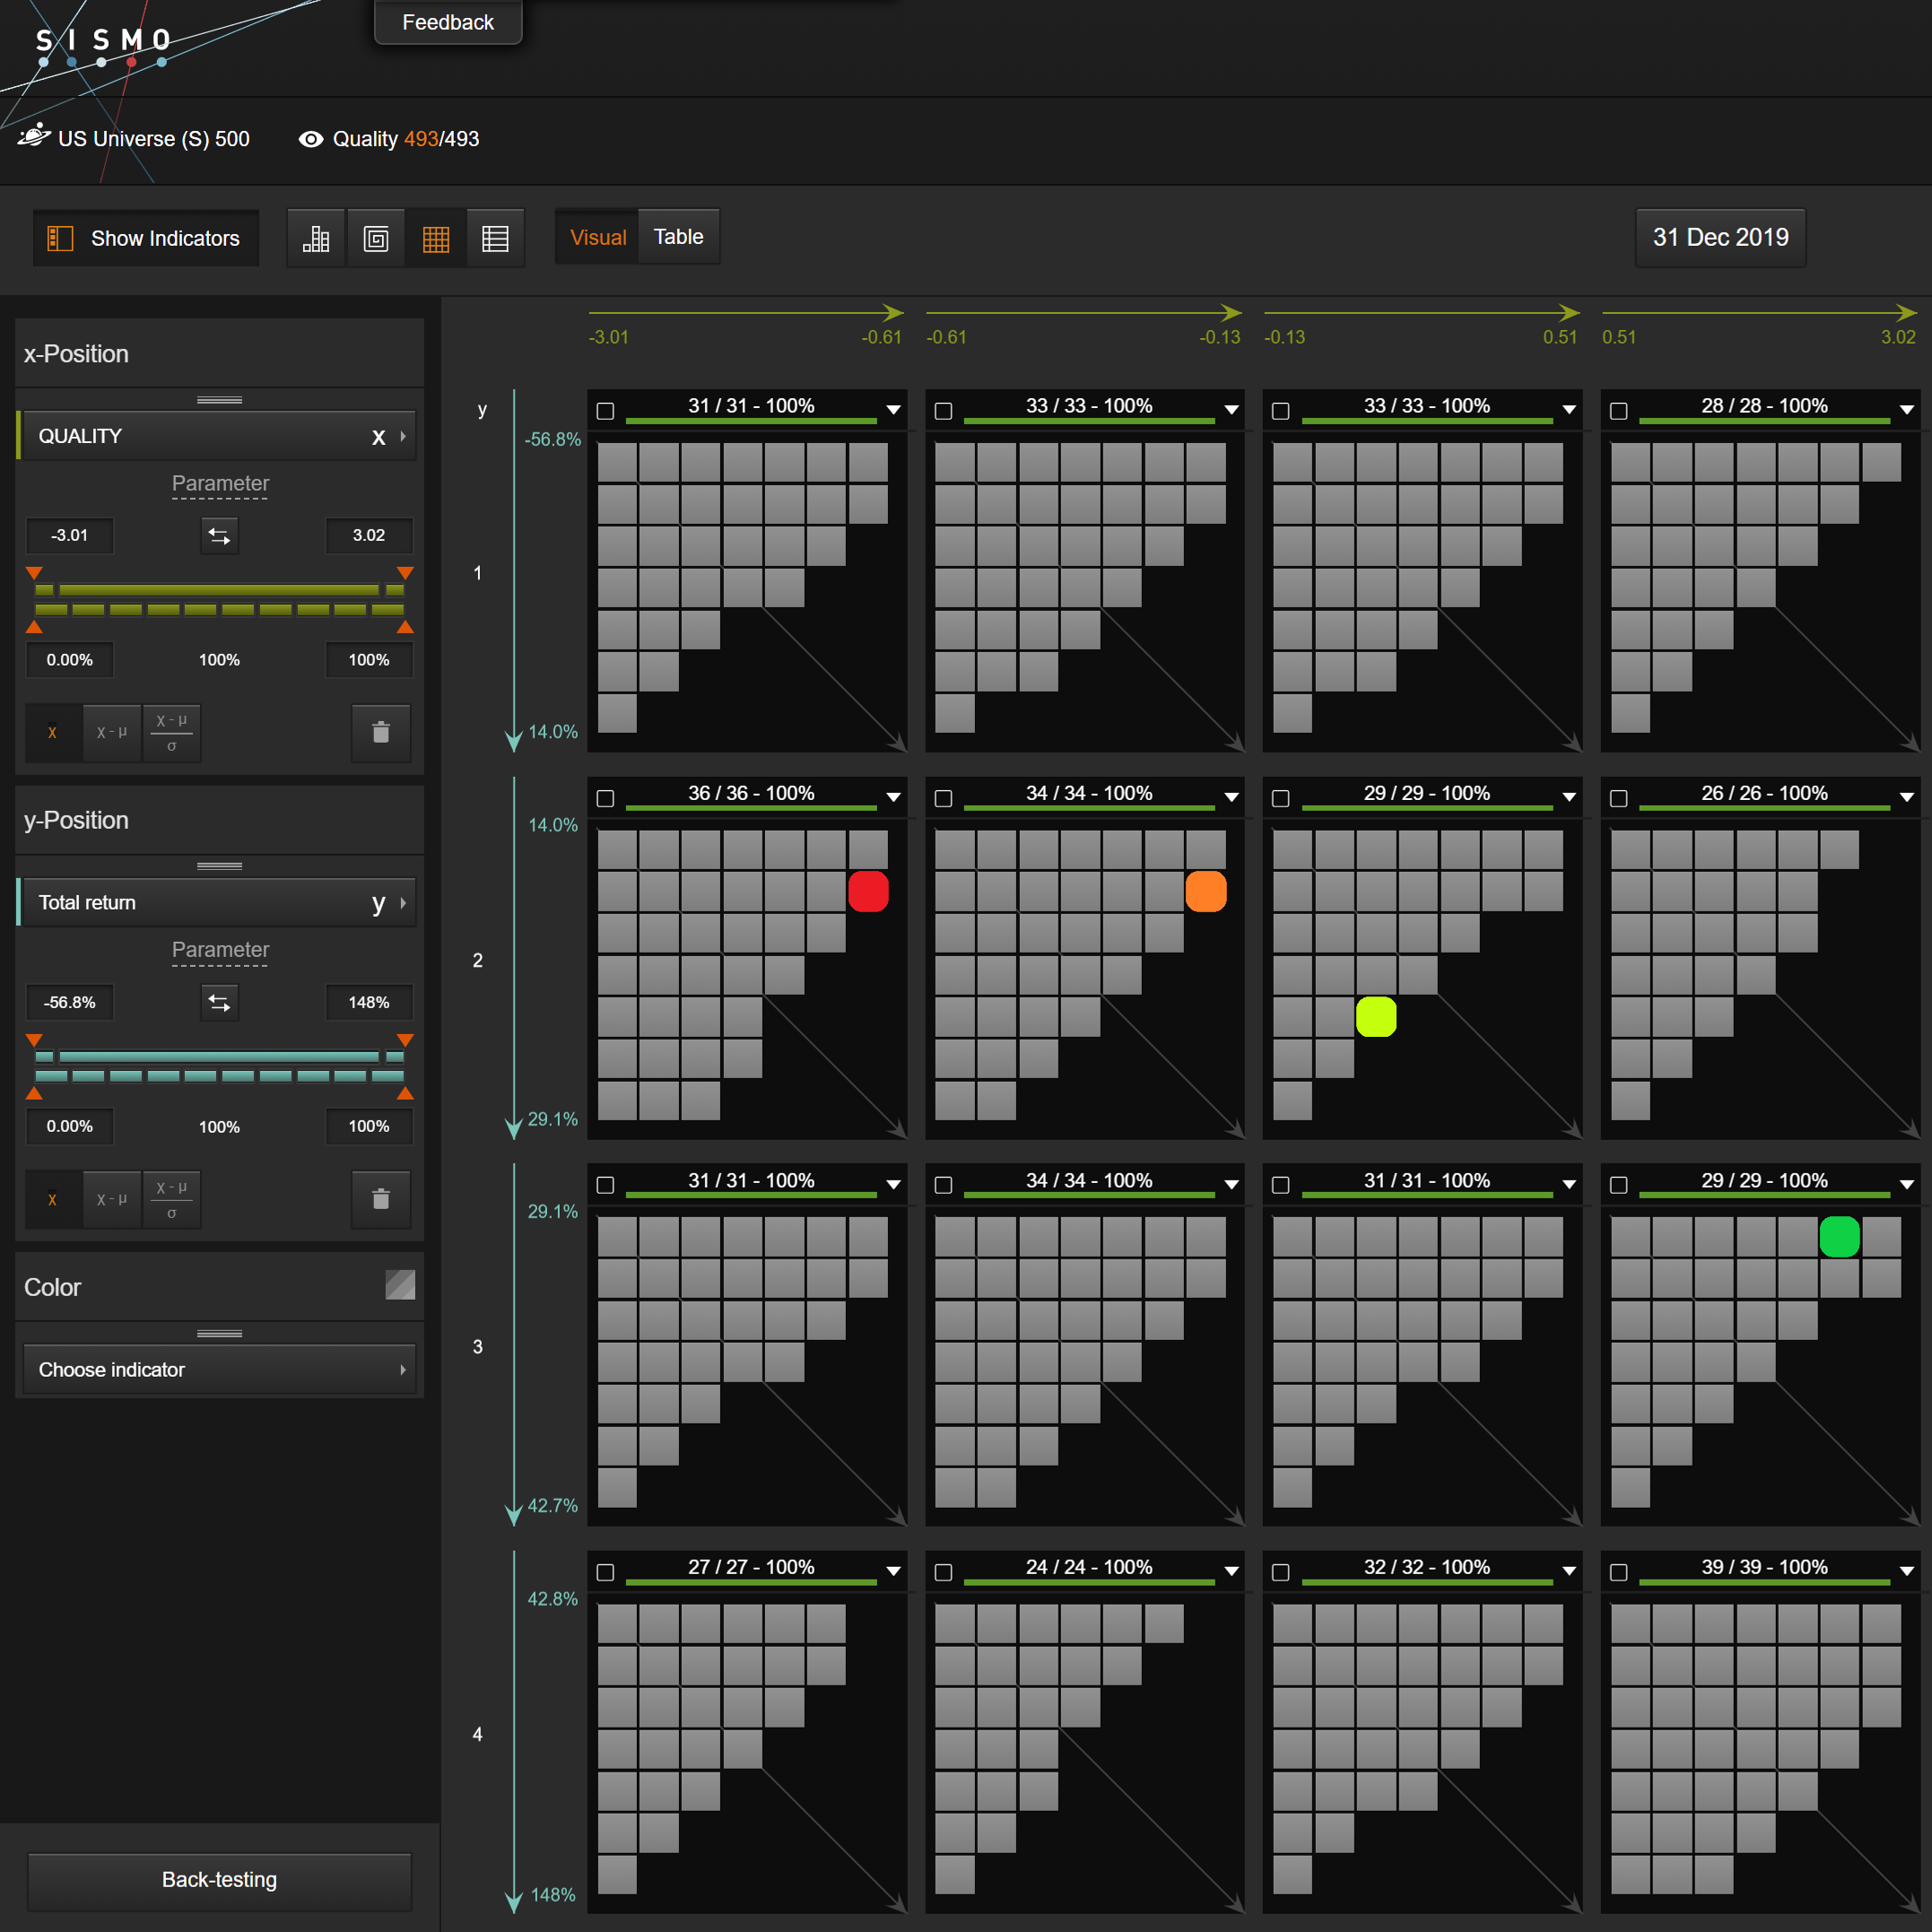
US : investors chased high Quality stocks in 2019 as Q4 companies strongly outperformed other quartiles by 7-8%. Among this list of strong performers are LAM Research (+119%), Blackstone (96.3%) and MSCI (+77.2%).
Quality Factor positioning vs 2019 performance – Europe universe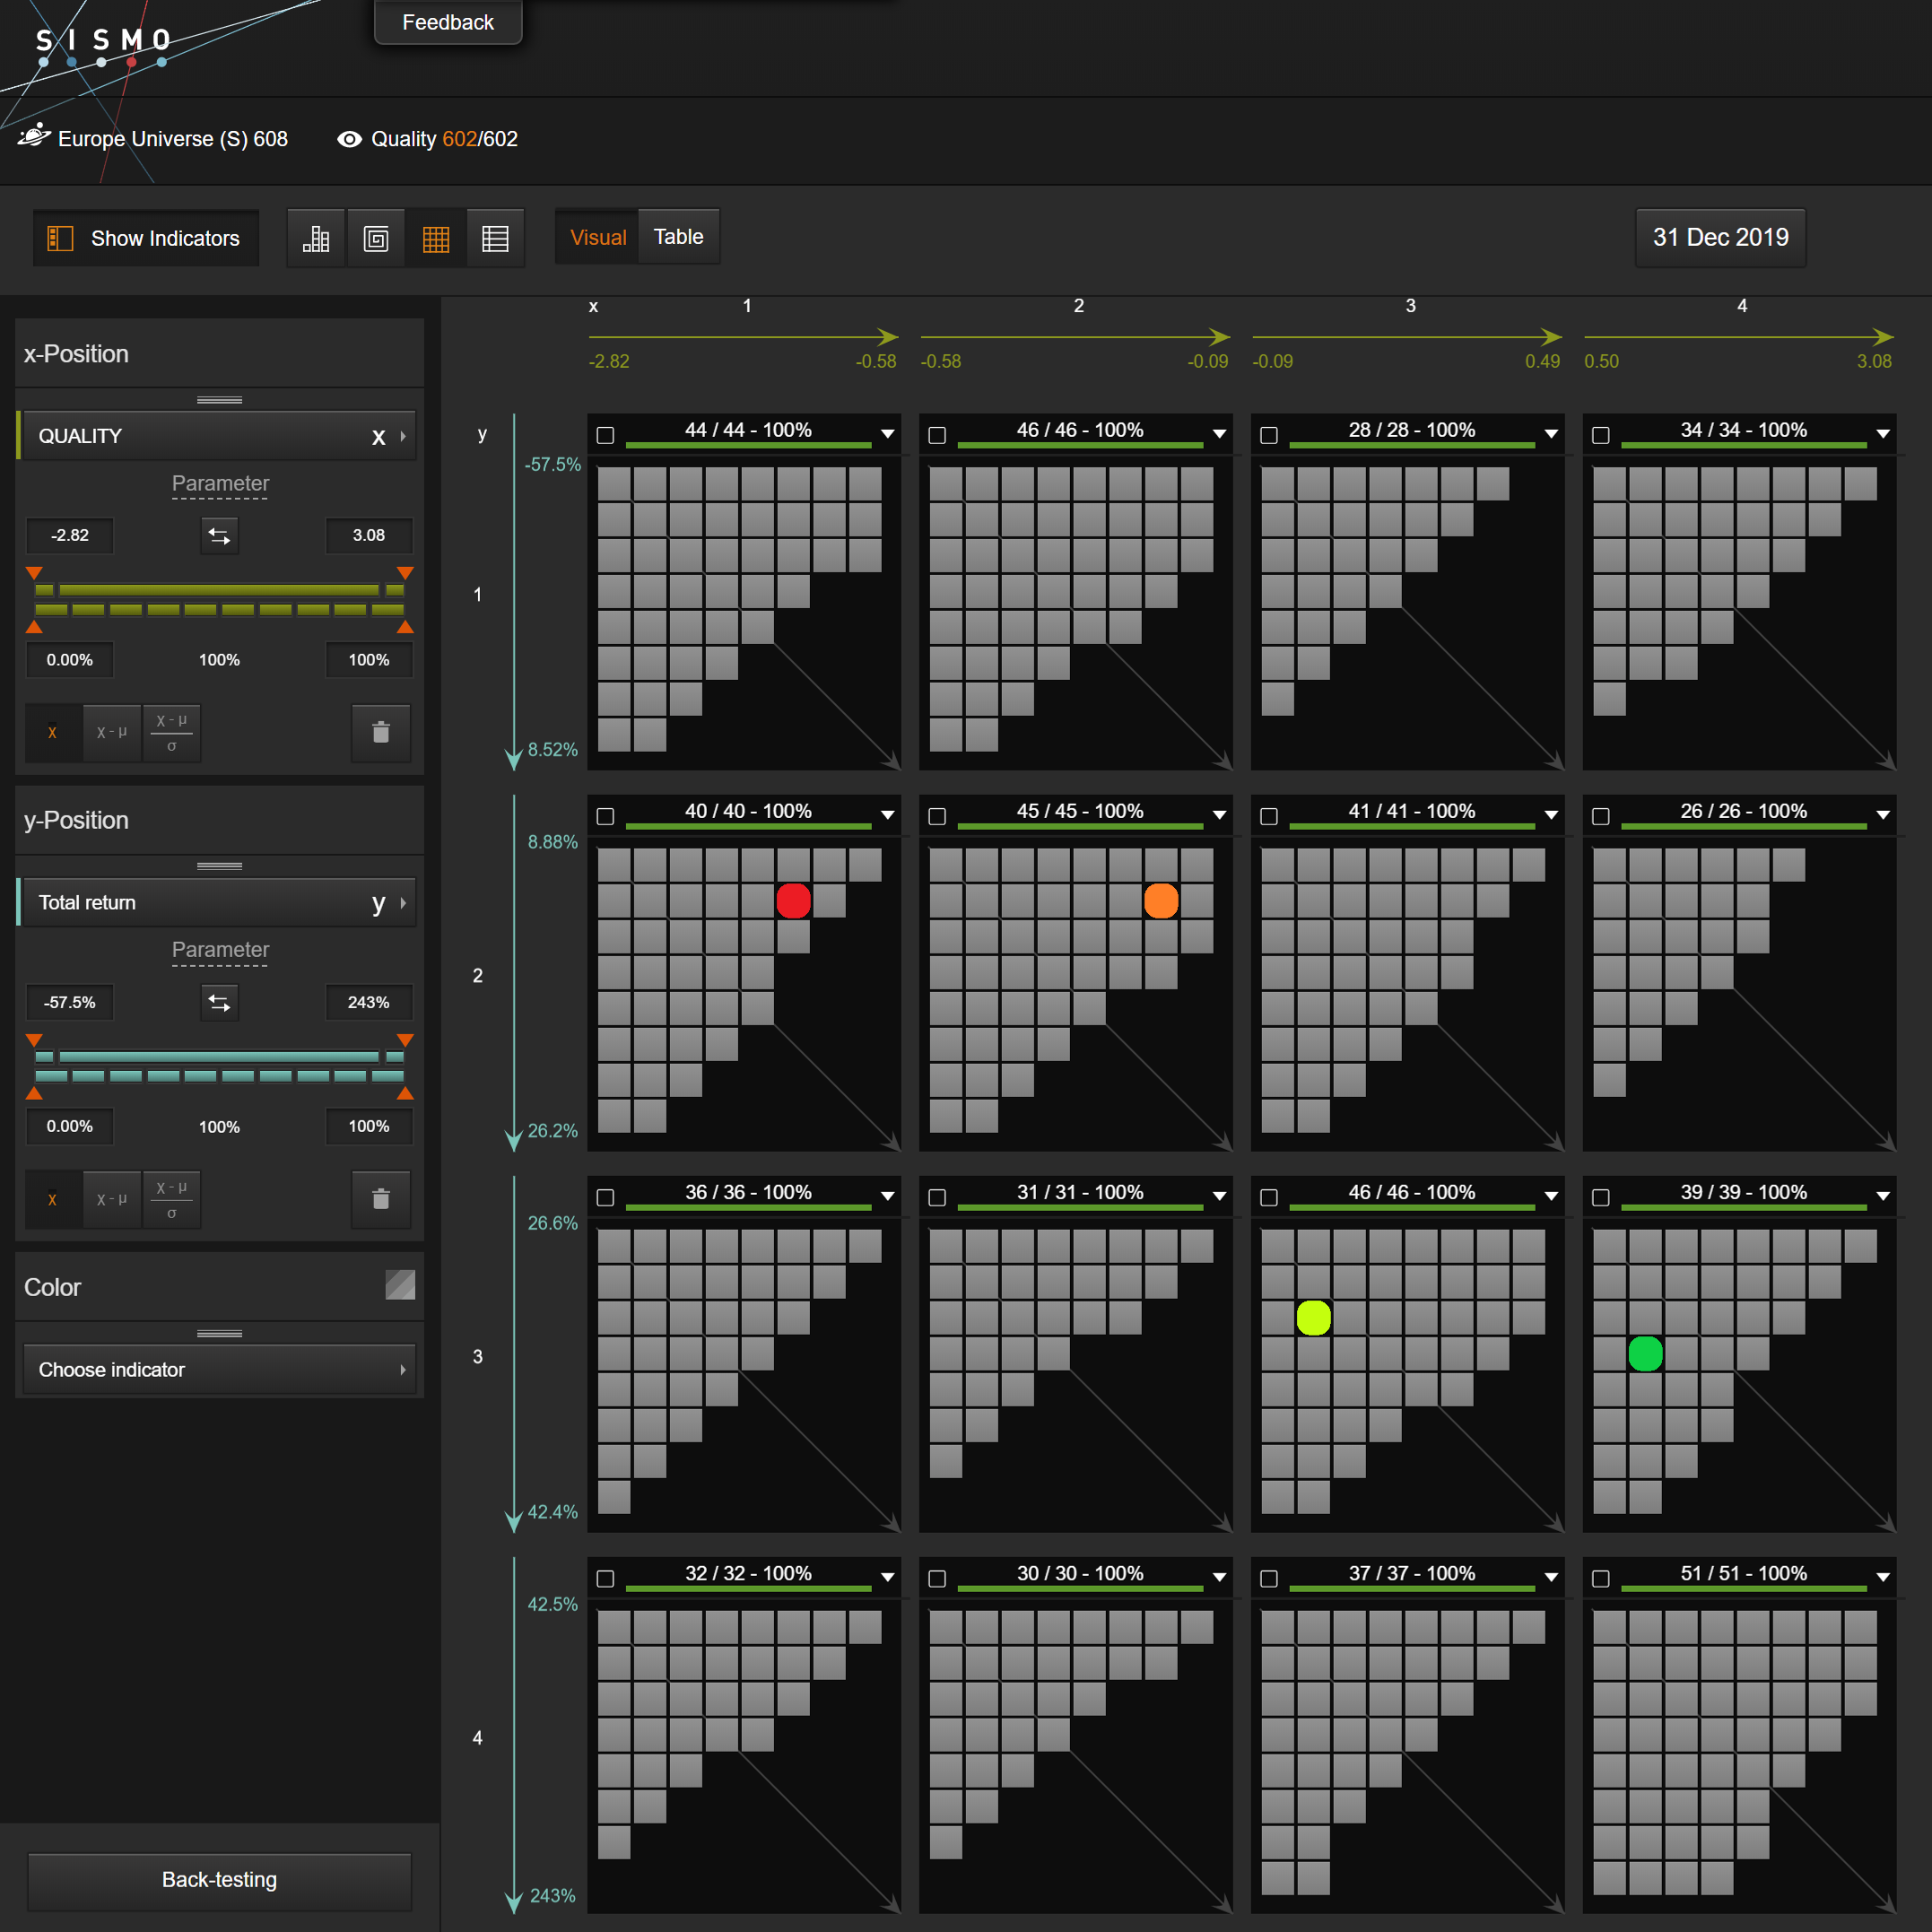
EU : a similar pattern emerged in Europe with high Quality Q4 companies outperforming other quartiles by 5-10%. Among this list of strong performers are Atlas Copco (+81.1%), Next (+81%) and Sartorius (+70%).
Conclusion
The charts below provide a summary of Factor Quartiles performaances for both US and Europe universes.
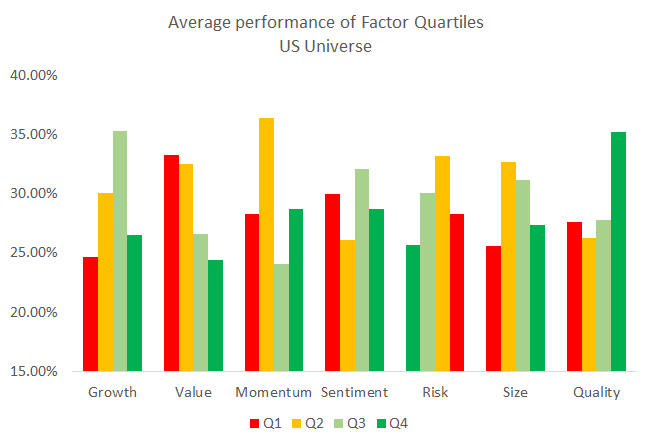
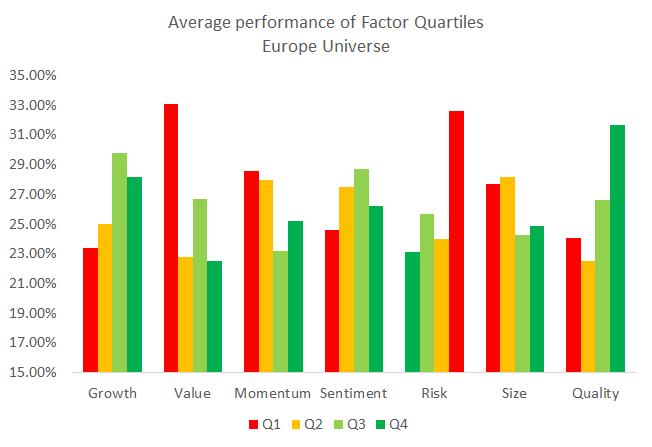
In short, the US and EU markets generally rewarded expensive Quality companies, which became even more expensive as a result. The markets therefore enter 2020 at record high valuations. More specific to Europe, risky stocks battered in 2018 exhibited strong reversal in 2019.

2,567 total views, 2 views today