
06 April 2020
Chasing investment opportunities? Look up for sectors with wide dispersal…
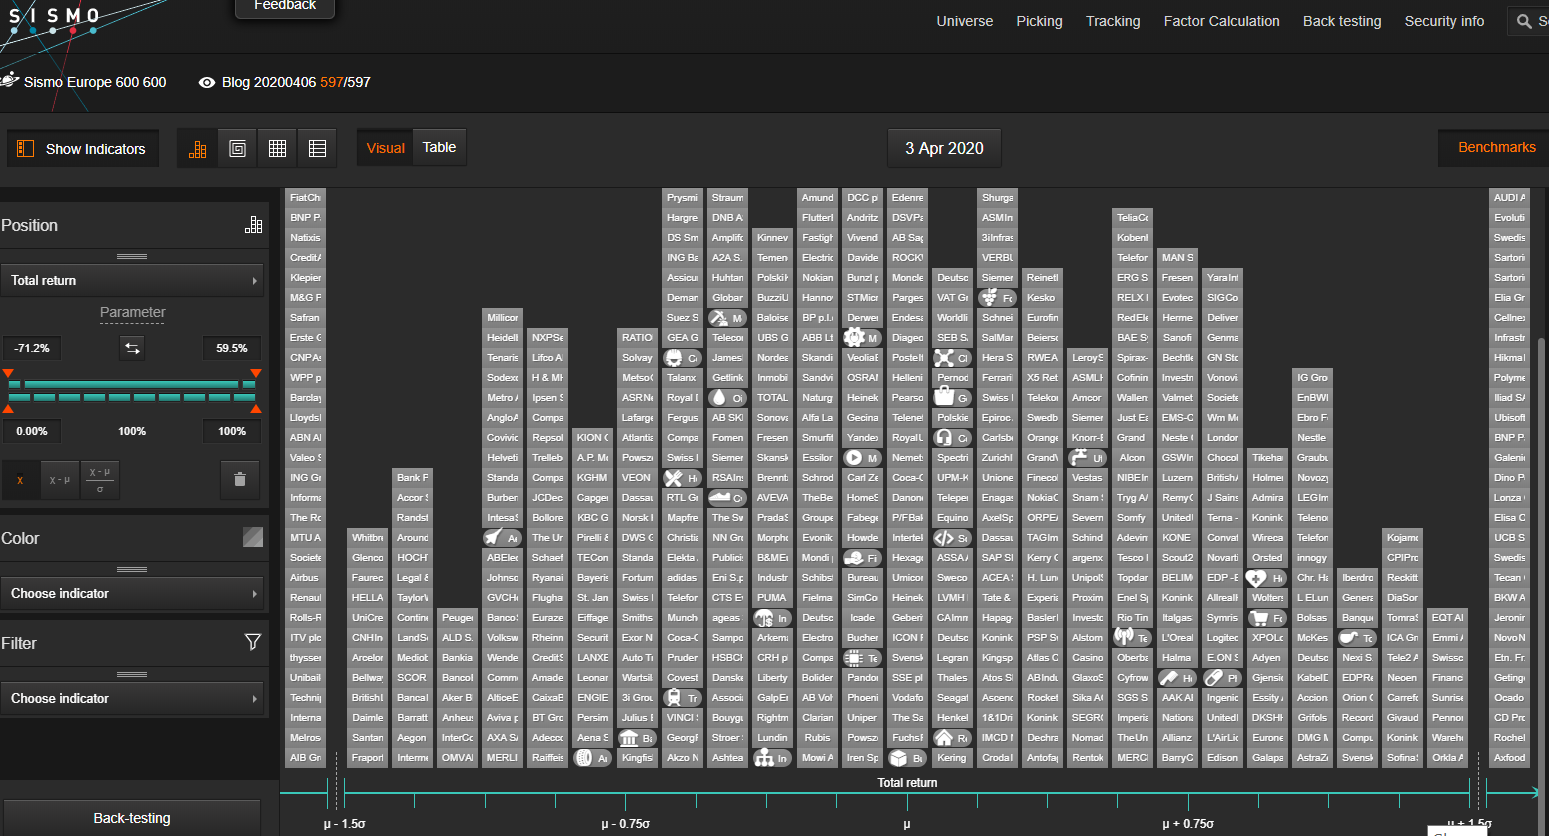
All economic sectors have been severely hit by the current market downturn. But a closer look shows the massive dispersion of sector returns. On the chart below, we display from left to right on the x-axis the distribution of year-to-date returns for the largest 600 European stocks (1 tile = 1 stock) and the average return of each of the 30 sectors in this universe (each sector average is represented by a tile with an icon). Sadly, the most Covid19-immune sector to date (represented by the icon furthest to the right on the chart) is Tobacco (-0.40%) followed from right to left by usual suspects Healthcare Equipment & Services (-5.08%) and Food & Drug Retail (-5.34%). On the other side of the spectrum on the left side, Aerospace & Defense (-43.4%), Automobile & Components (-40.0%) and Banks (-37.4%) are the hardest hit sectors.
YTD total returns of the Top 600 European Stocks and 30 sectors as of 03 Apr. 2020
But the focus on average sector returns is a case of not seeing the wood for the trees as there are huge disparities within certain sectors. A porfolio manager looking for bargain stocks or relative value trades may choose a top-down approach and focus on sectors with the largest dispersions.
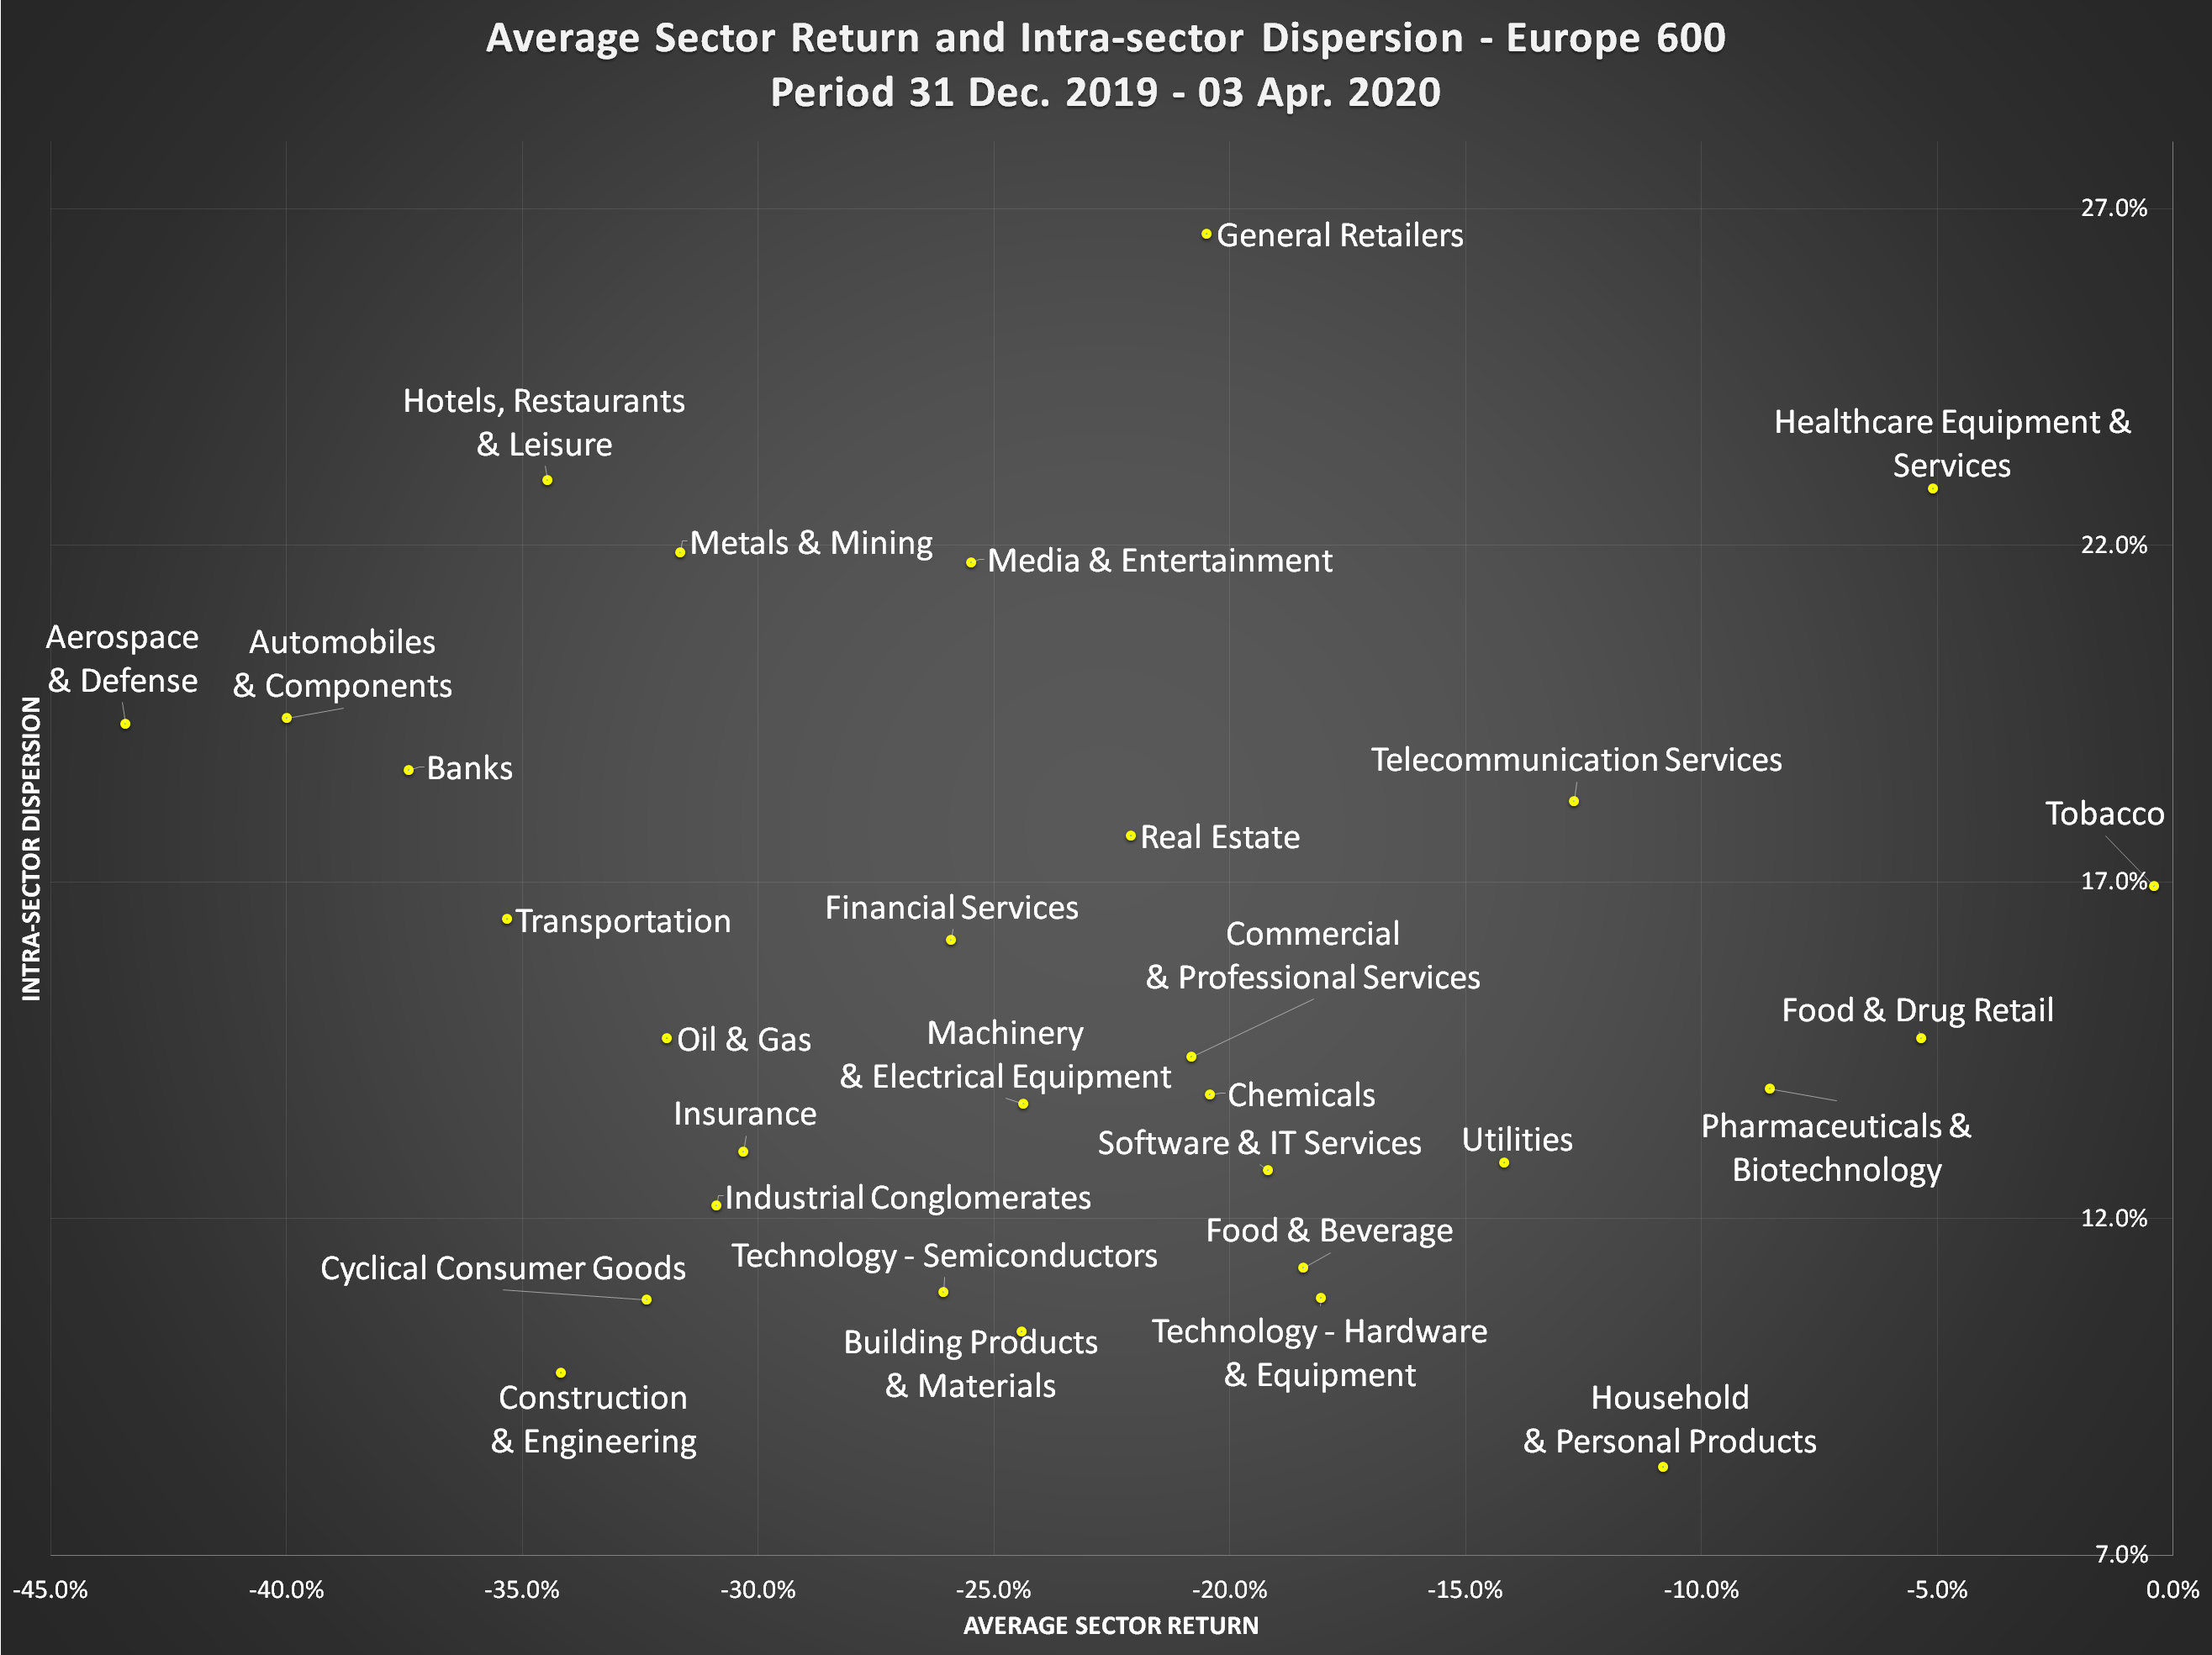
On the scatter plot below, we display sector returns on the x axis and intra-sector dispersion – measured as standard deviation of returns within each sector – on the y-axis.
Construction & Engineering and Household & Personal Products sectors exhibit dispersion below 10%, indicating that stocks from these sectors moved in unisson. On the opposite, General Retailers, Hotels/Restaurants & Leisure and Healthcare Equipment & Services exihibit extraordinary dispersion. Take two random stocks from one of these sectors: on average, their return difference is larger than 22%! Investors looking for misvaluations will probably save some time by looking for opportunities in such ectors.
YTD Sector Return (x-axis) and Intra-Sector Dispersion (y-axis) for Top 600 European Stocks as of 03 Apr. 2020
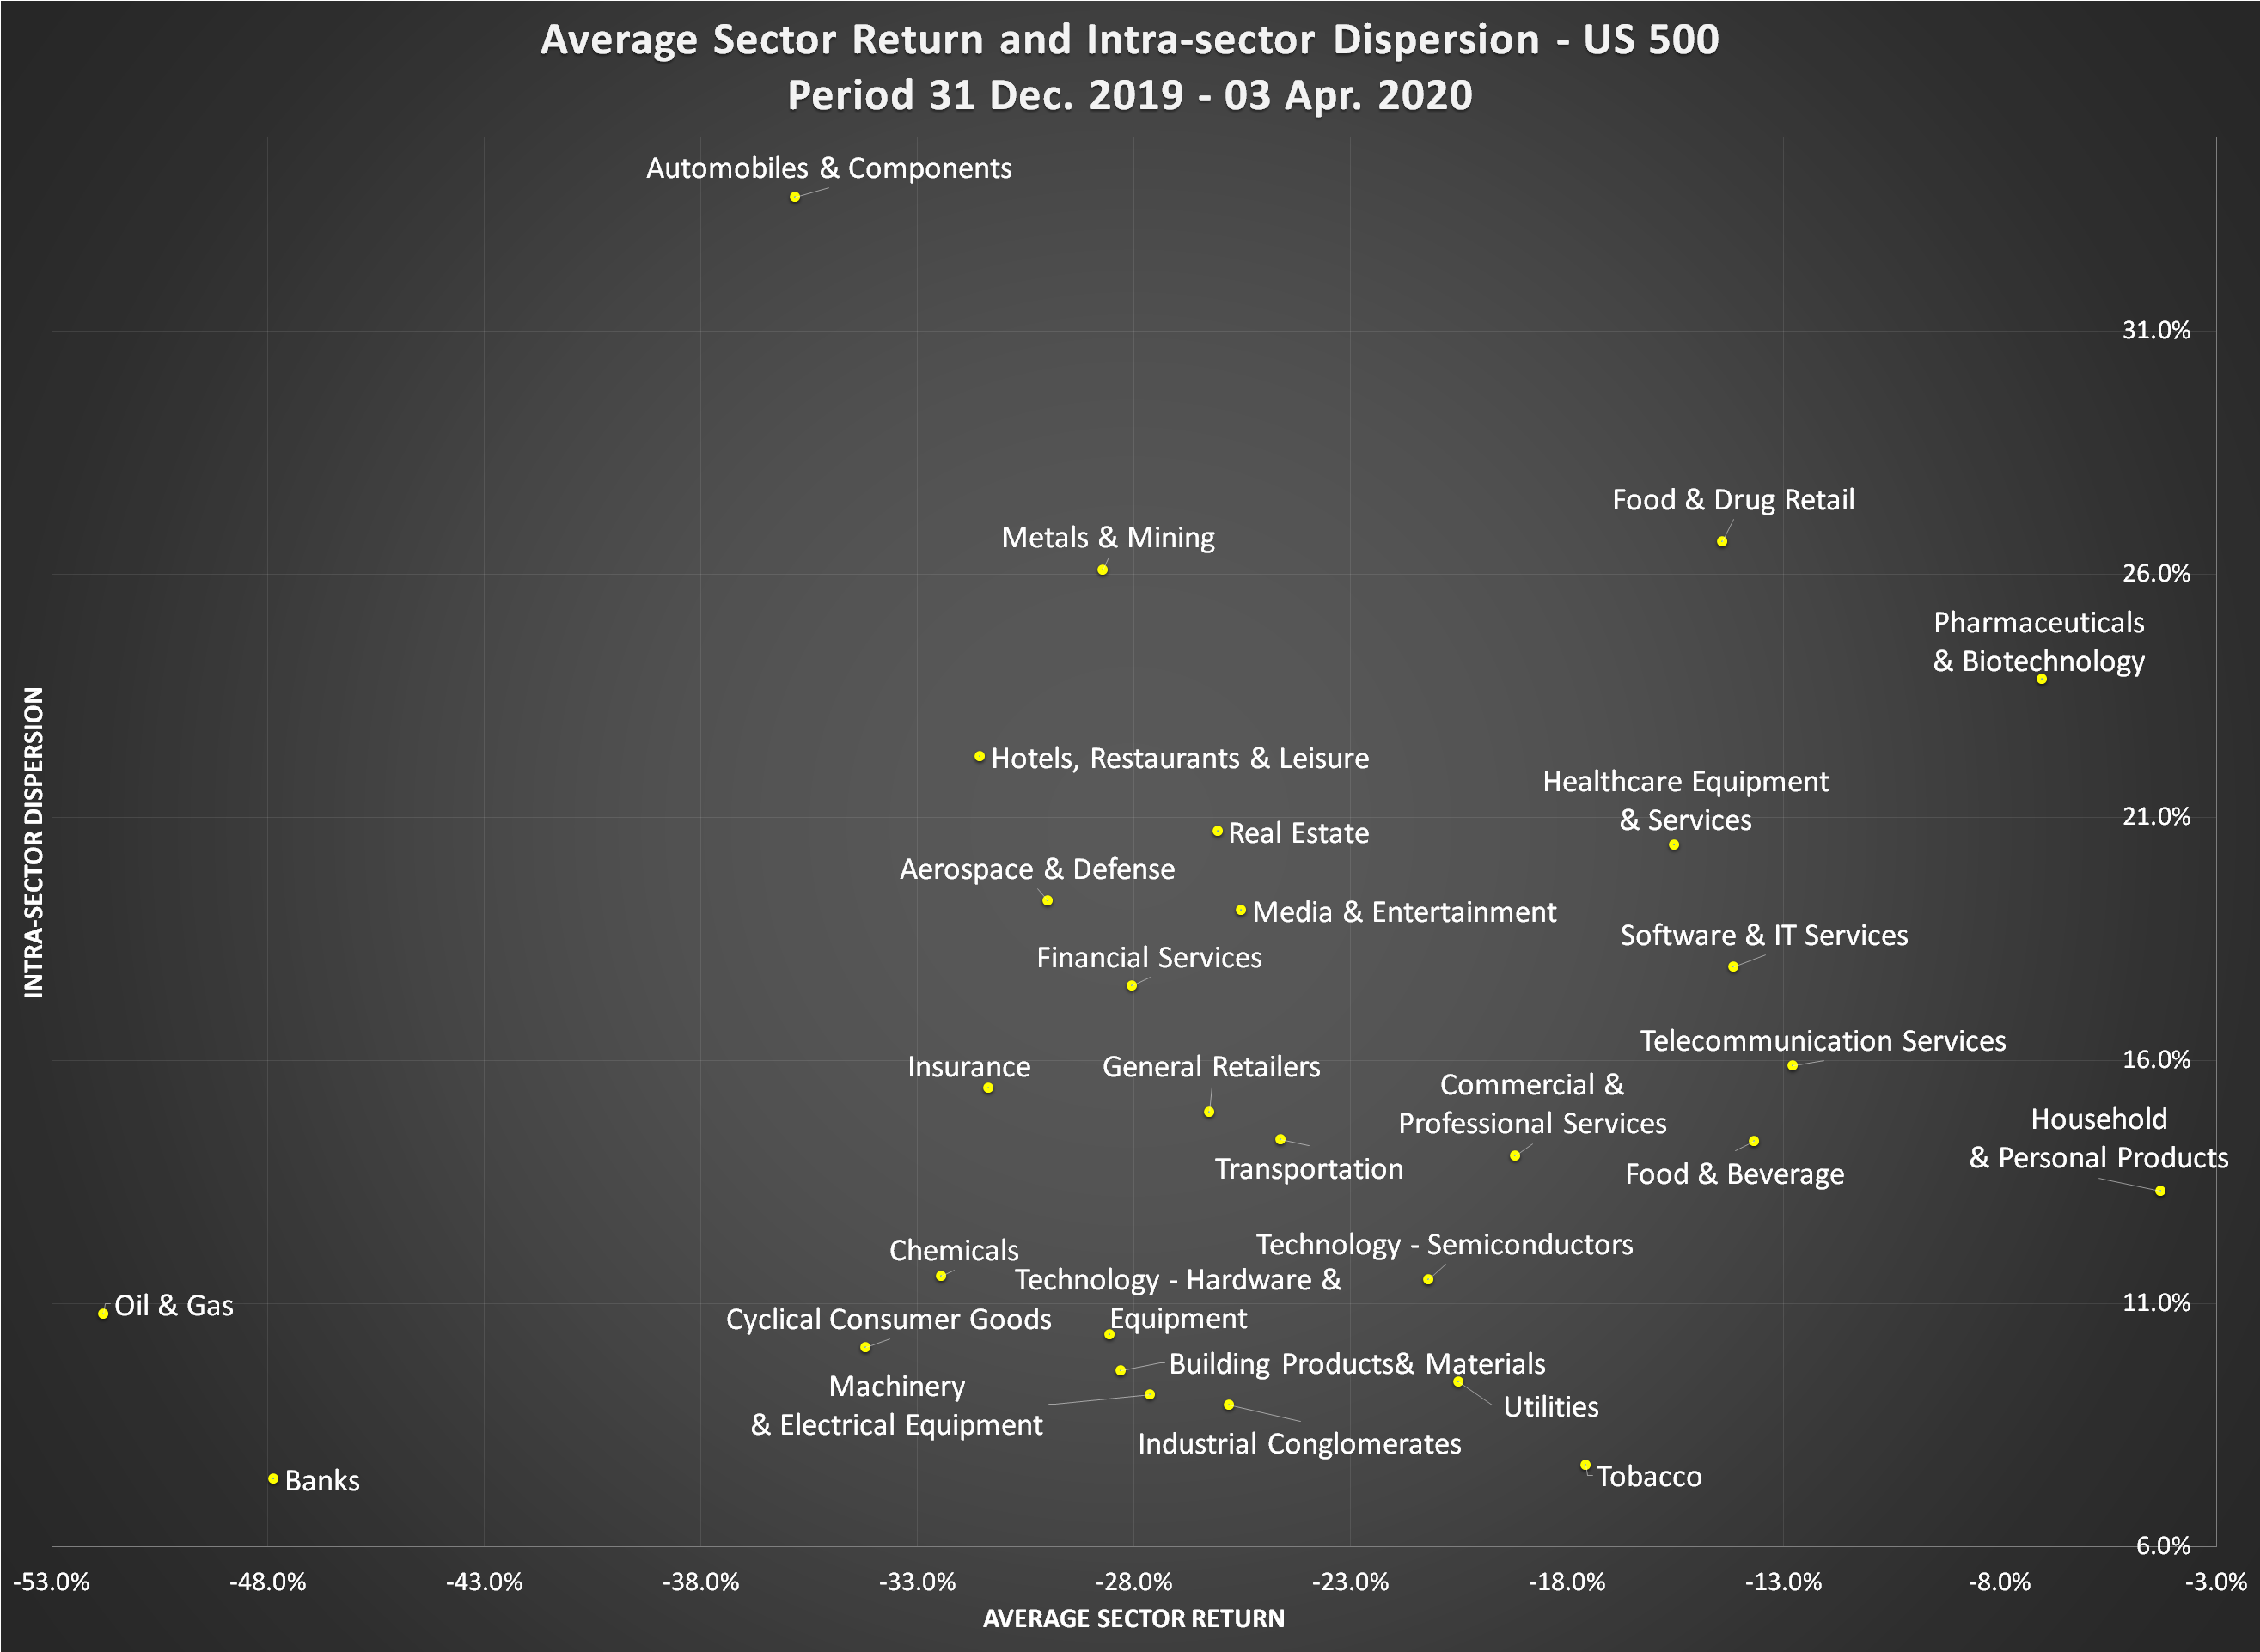
For
the sake of exhaustivity, we show below the same dispersion scatter plot on the
US market. It is remarkable that the 14 largest banks dropped by a staggering
47.9%… with record low dispersion of 7.4%! On the other hand, Automobile
& Components sector was also severely hit but with a much larger dispersion
of 33.8%.
YTD Sector Return (x-axis) and Intra-Sector Dispersion (y-axis) for Top 500 US Stocks as of 03 Apr. 2020
2,298 total views, 1 views today