
13 January 2021
A Bumpy Year in Retrospect: Insights from Rank Analysis
It has now become a traditional exercise to look back at the winners and losers of the past year on the stock market. We tackle it this year on European stocks through the lenses of rank analysis, a recently introduced feature in the Sismo analytics toolkit.
Out of the largest 1000 European stocks at 31 Dec. 2019, we define a “Top 50” and a “Bottom 50” list by grouping the 5% stocks with the highest (resp. lowest) 2020 total return (ie stock performance with dividend reinvested).
Stocks in the Top 50 list had on average a 100% total return in 2020. The list is led by Swedish telecom group Sinch (+368%) and includes companies such as Orsted, Adyen, Neste Oyj, Infineon Technologies, Lonza, Vestas, etc. In total, 19 companies out of 50 are Scandinavian while only 4 are listed in the UK (Ocado, Fresnillo, Games Workshop Group, Antofagasta) and 6 are France-based (Trigano, Neoen, Sartorius Stedim Biotech, Somfy, Soitec and La Française des Jeux).
Stocks in the Bottom 50 list had on average a negative -50% total return in 2020. They includes oil & gas companies (such as Royal Dutch Shell, BP and Saipem), banks (Lloyds, Société Générale, Unicredit), real estate groups (Klepierre, Unibail, Hammerson), airlines (Air France, ICA), etc. In total, 14 companies are UK-based, 8 are French, 6 are Italian.
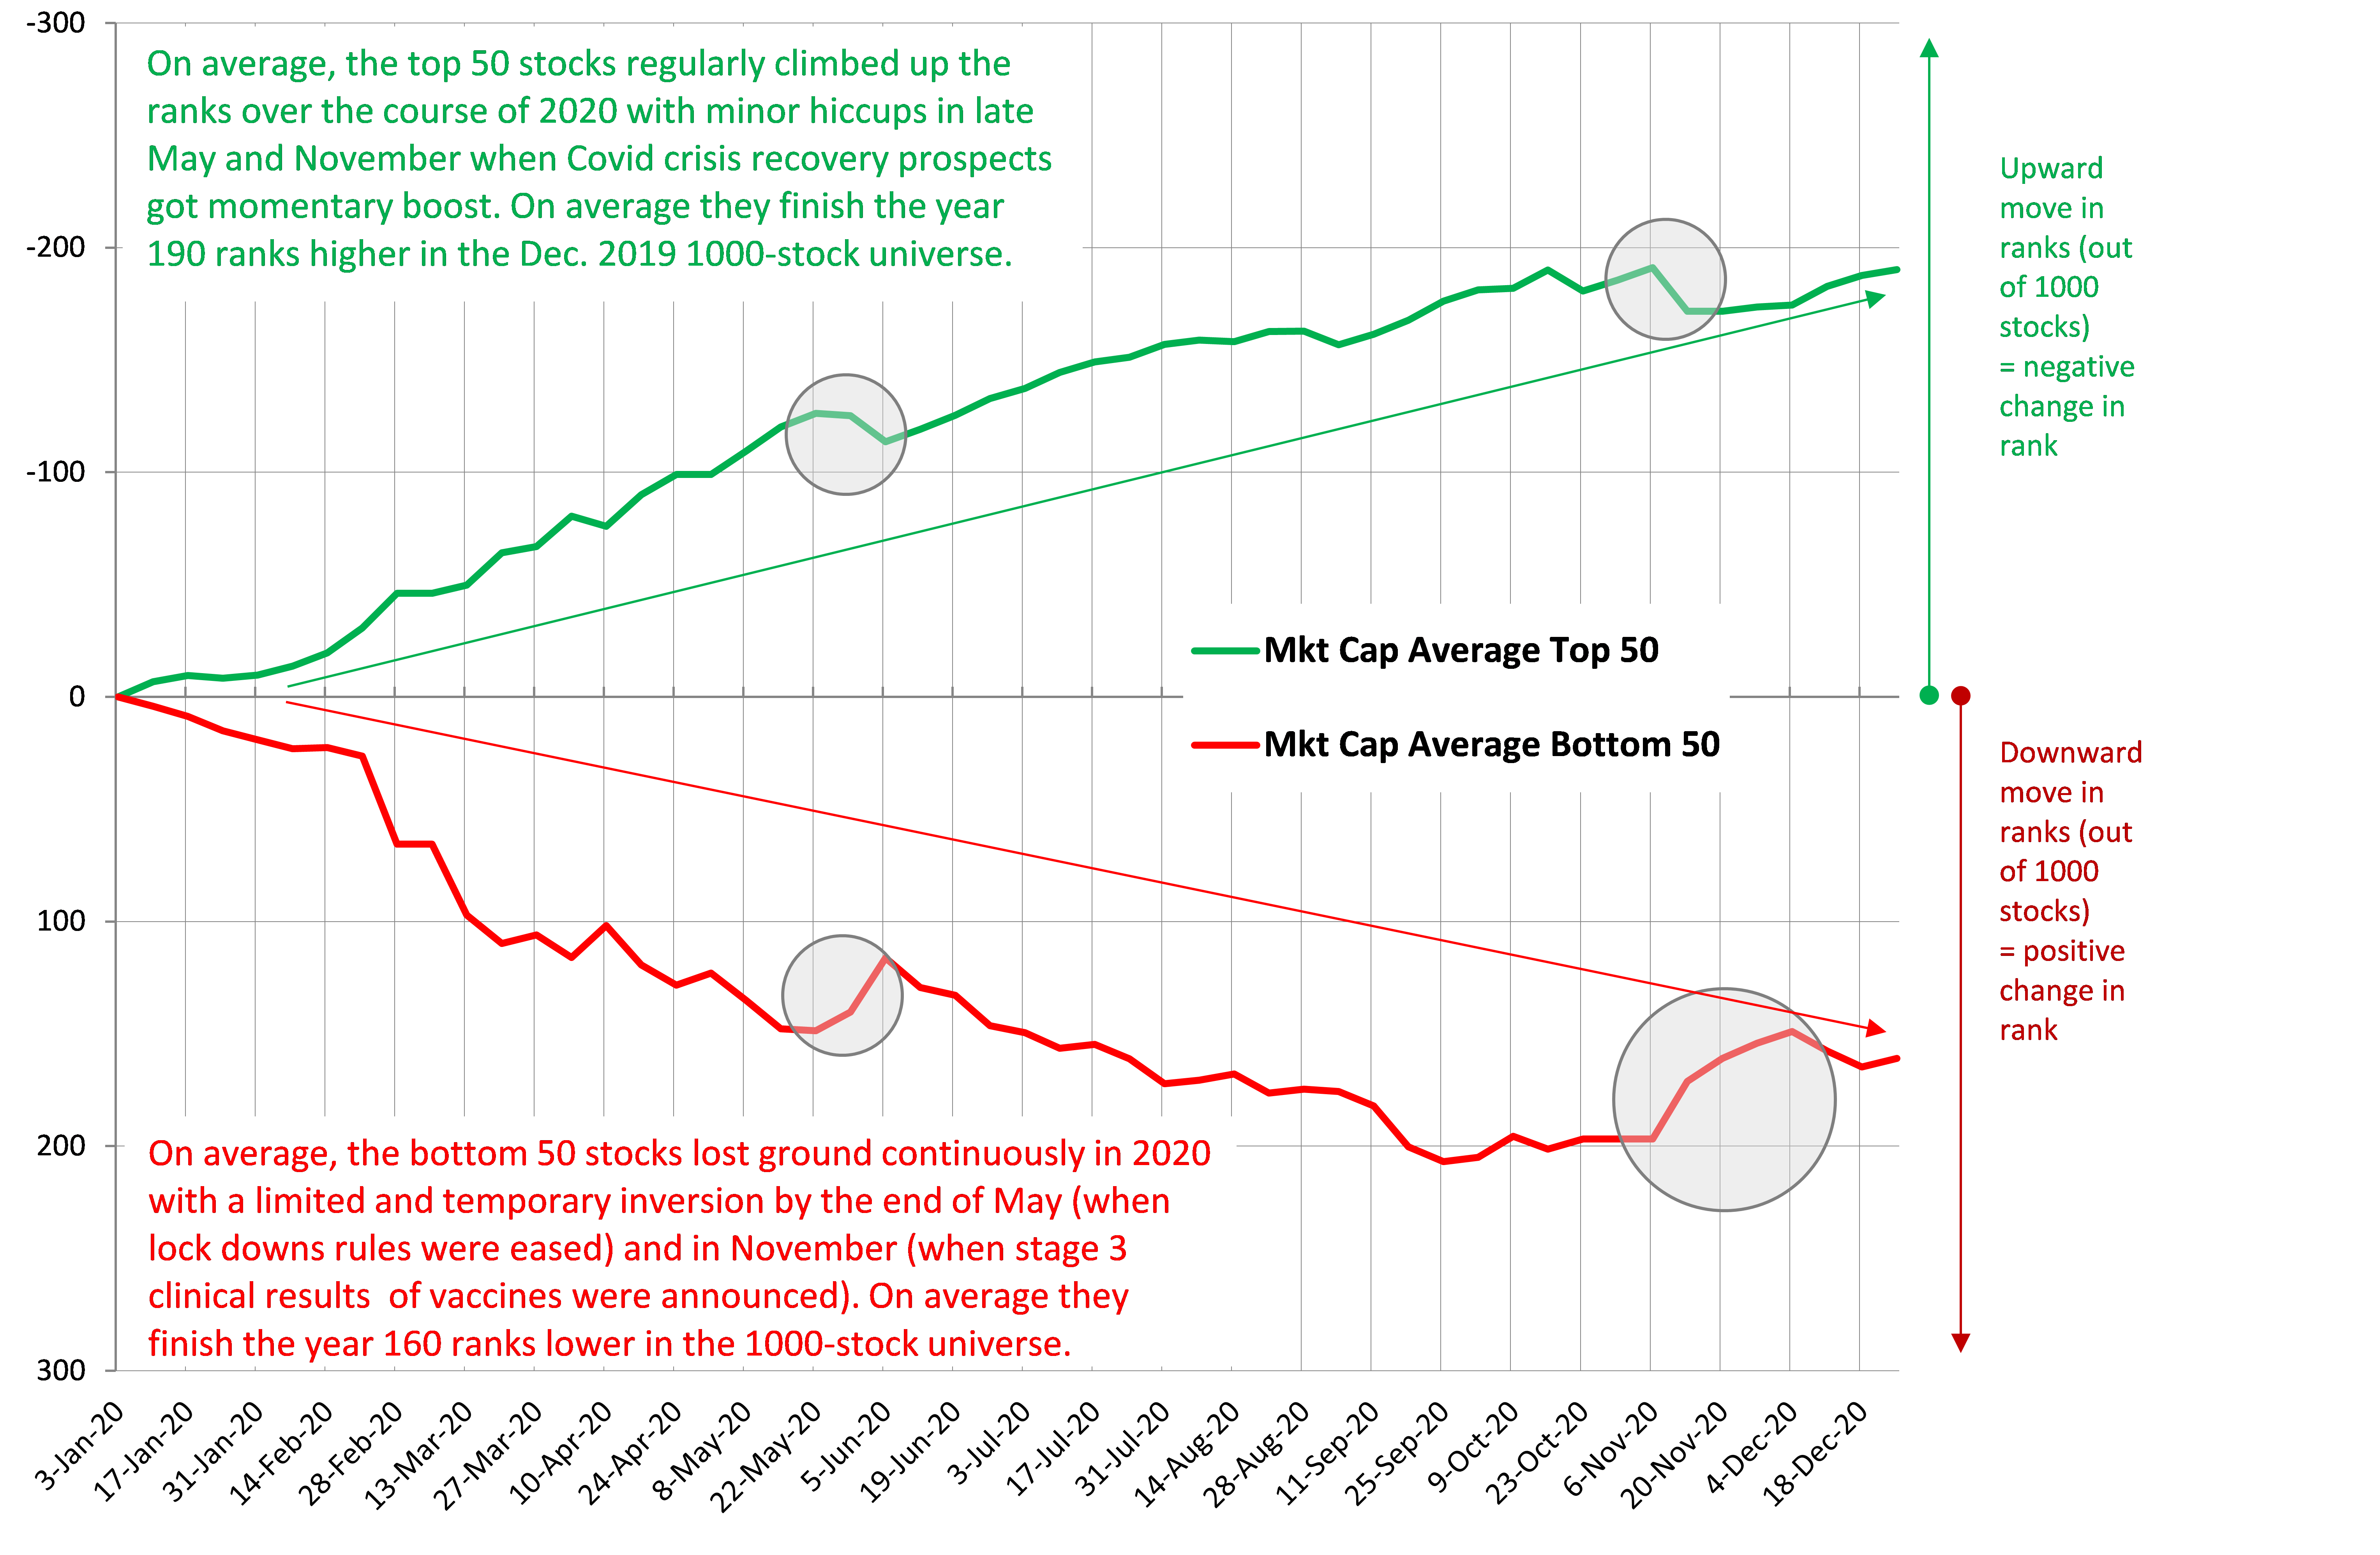
With Sismo, we ranked companies every week according to their market cap, starting at the end of 2019 (from 1 to 1000, 1 being the largest company). Out of the initial 1000 companies, the Top 50 companies have gained on average 190 ranks over the course of the year 2020 while the bottom 50 companies lost on average 160 ranks (beware, in the charts below, an upward move in ranks is associated with a negative change in rank: e.g. a stock moving upward from rank=500 to rank=350 out of 1000 stocks exhibits a change in rank of -150, conversely a stock moving downward in ranks, say from rank=150 to rank=400 exhibits a positive change in rank of +250).
The most striking feature observed is the regularity of the pattern over the year. Obviously this has to do with us averaging moves over 50 stocks: stock by stock, patterns are less regular. But still, most of these stocks had already started their way either up or down the ranks before the pandemic hit the market in March and their move relative to other stocks has been quite steady over the course of the year.
The momentary reversals that took place in late May when lock down rules were eased and in November when positive stage 3 vaccines results were announced had a significant positive impact on the Bottom 50 stocks and a less acute negative effect on the Top 50 stocks, which shortly resume their upward move.
2020 Average Change in Rank for Top and Bottom 50 Stocks in a Universe of 1000 European Stocks
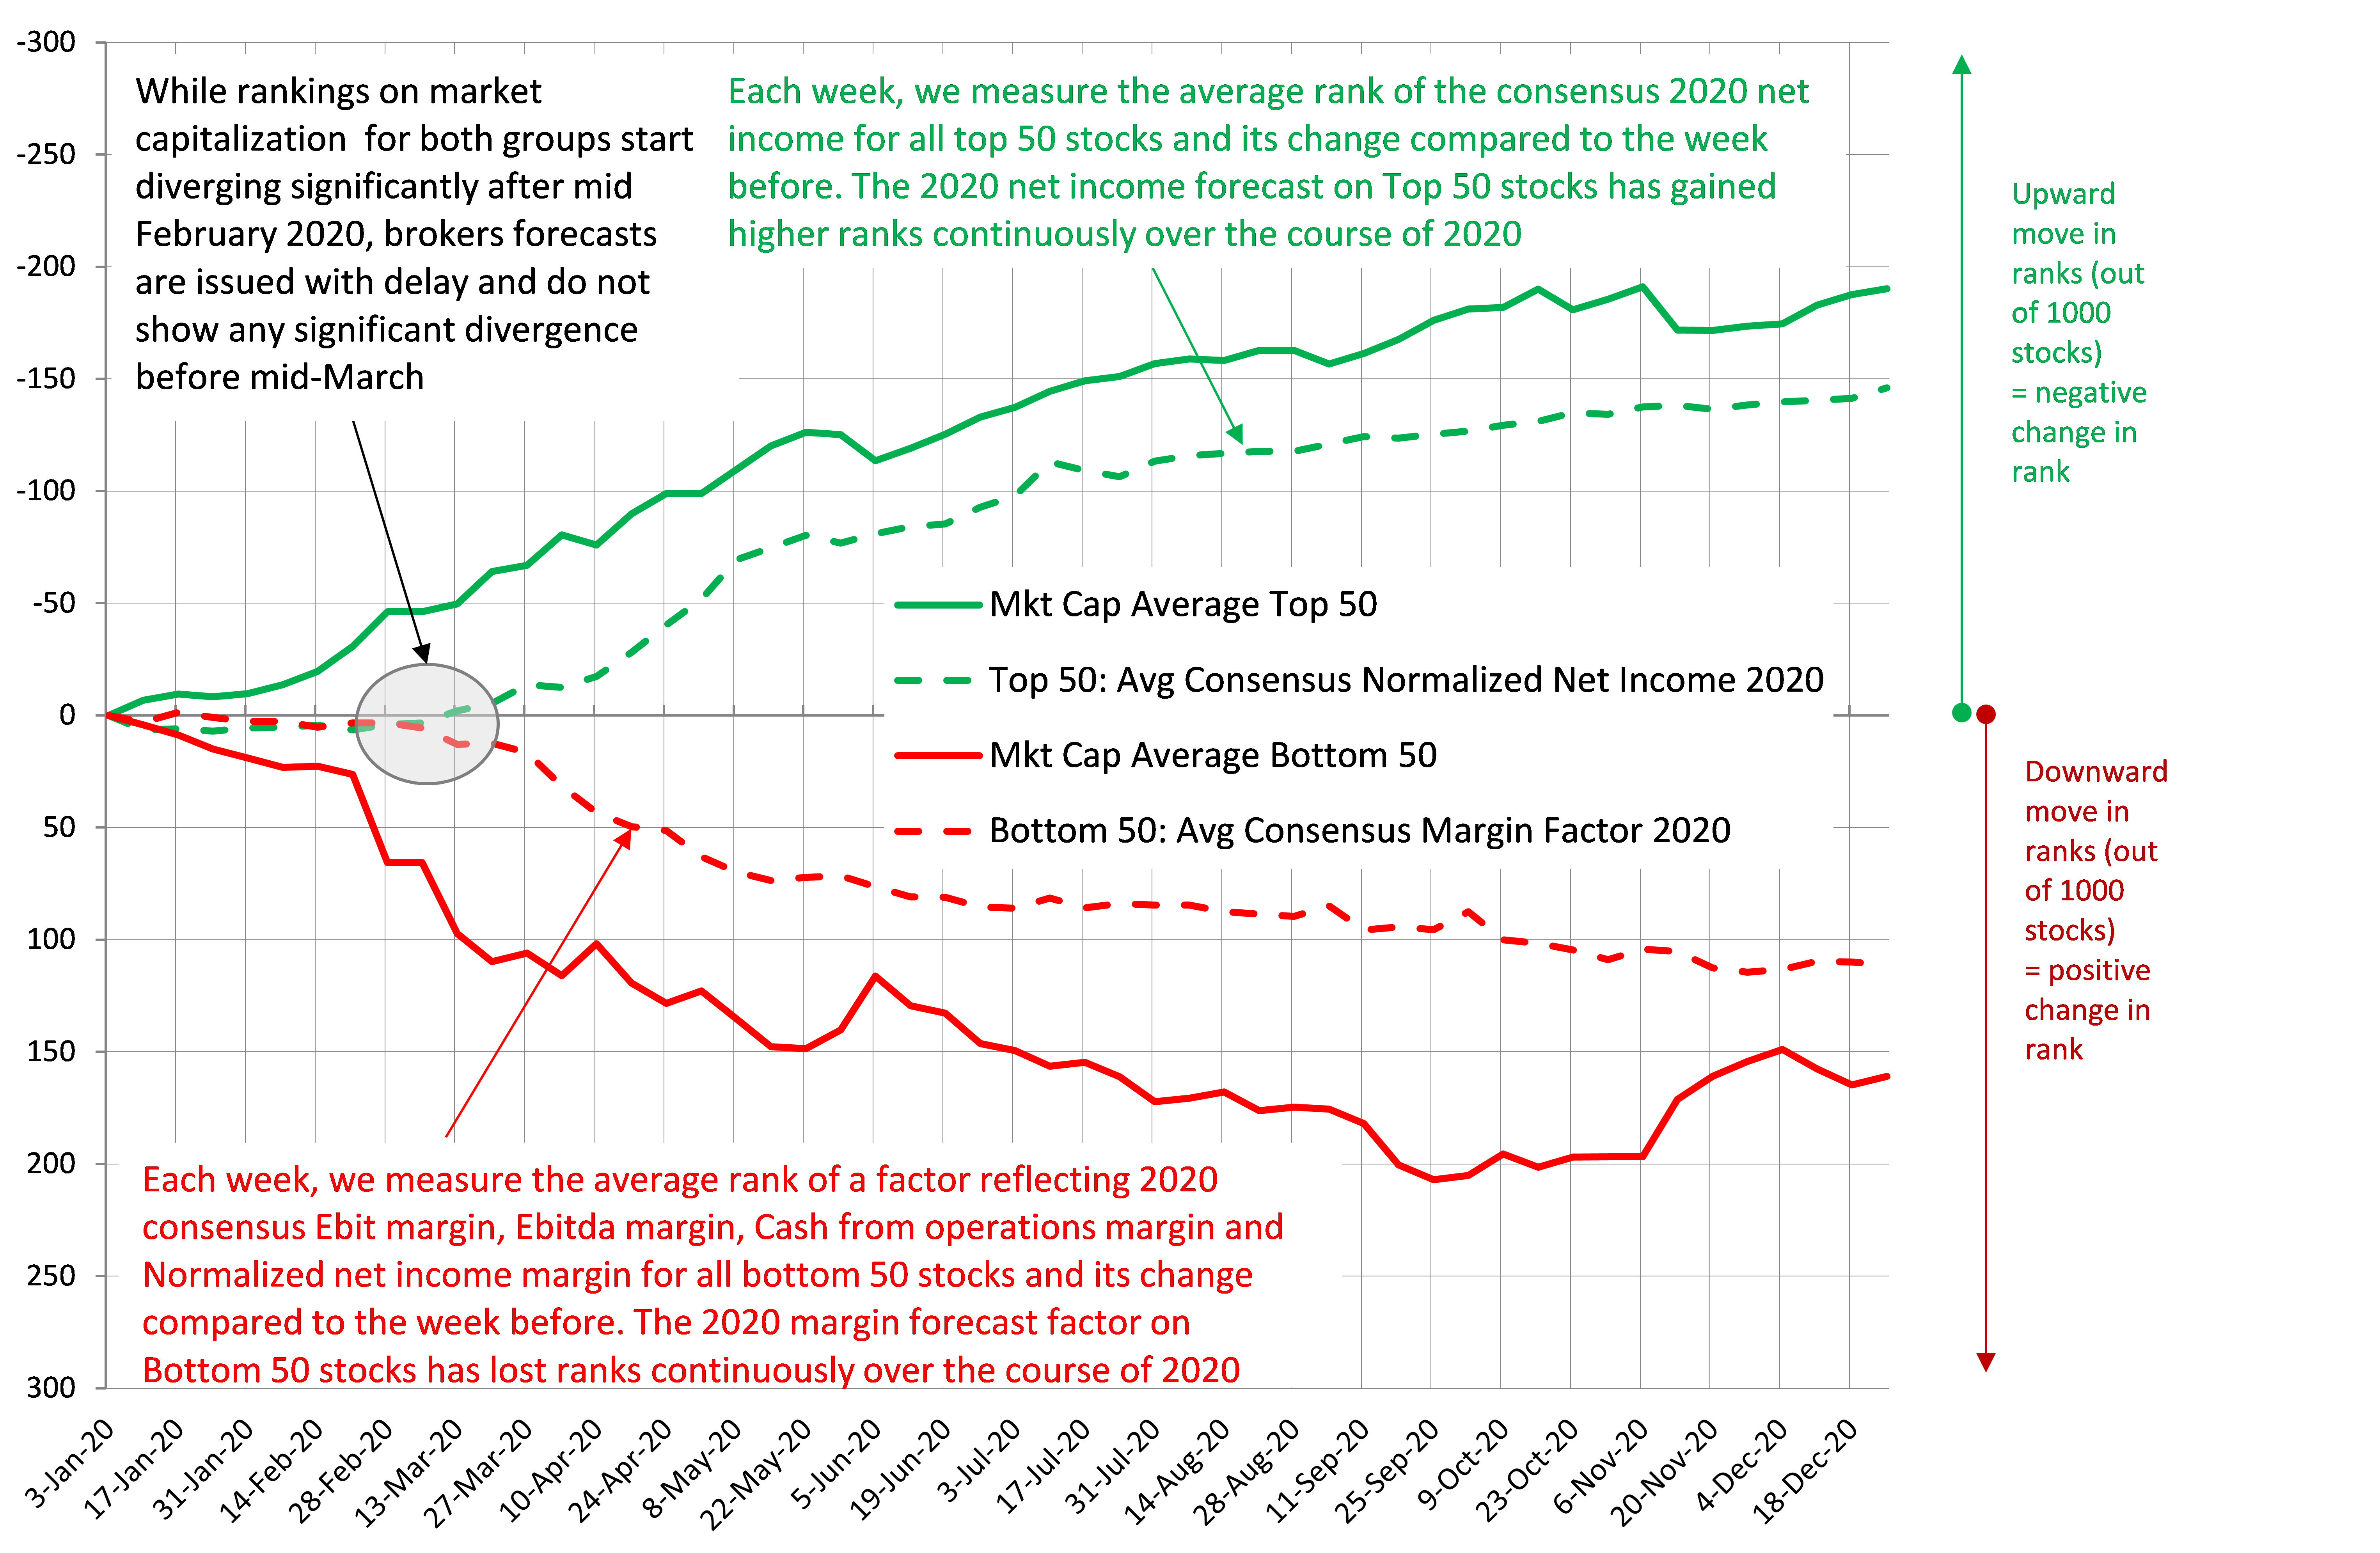
The rank analysis also offers the ability to track correlations between rank paths of various indicators for individual stocks of group of stocks.
We thus measured correlations between the market capitalization rank path of our Top 50 and Bottom 50 stocks and the rank path of various market, risk and brokers metrics with different parameters.
The highest correlation on 2020 weekly data is observed:
- for the Top 50 stocks, with the current year (2020) average consensus forecast for net income before exceptionals
- for the Bottom 50 stocks, with a Margin Factor we designed giving equal weight to sell-side forecasted Ebit, Ebitda, Cash from operations and Net income margins for 2020[1]
We plot below those series on the previous chart.
2020 Average Change in Rank for Top and Bottom 50 Stocks in a Universe of 1000 European Stocks
& Average Change in Rank for 2020 Consensus Normalized Net Income for Top 50 Stocks
& Average Change in Rank for 2020 Consensus Margin Factor for Bottom 50 Stocks
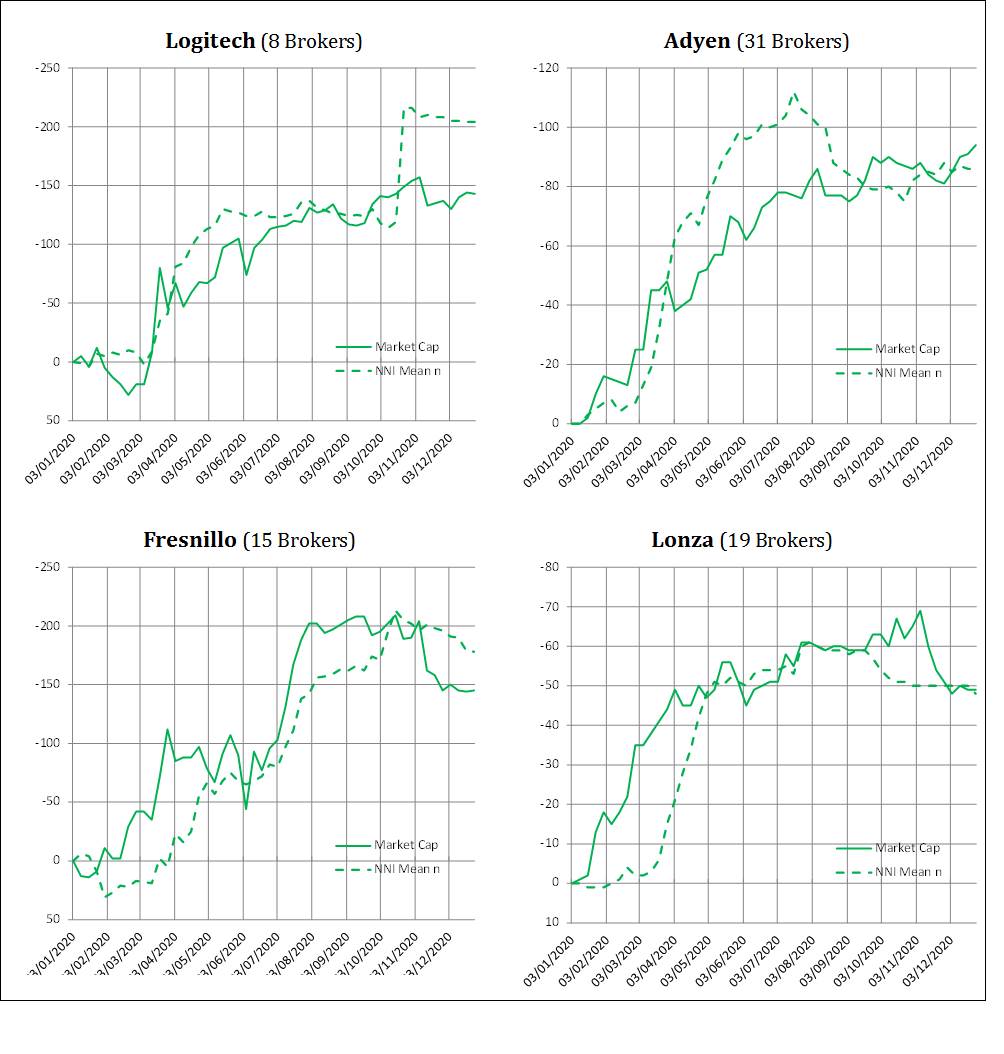
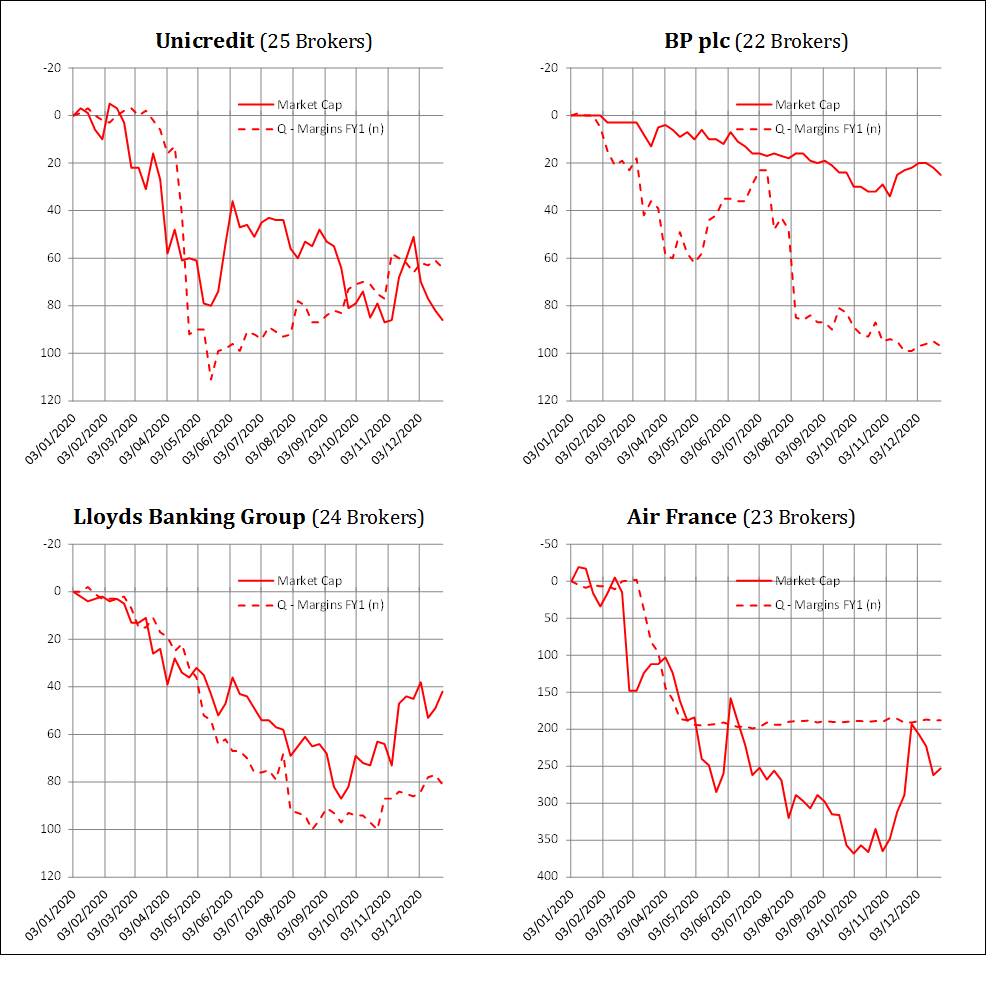
We also illustrate in appendix this correlation taking the example of 4 stocks from the Top 50 and 4 stocks from the Bottom 50 lists.
Conclusion
The stock markets had a wild ride in 2020, an unprecedented year in many ways. With a rollercoaster of ups and downs, stocks have seemingly gone in all directions. Yet, the focus on the relative positions of the largest 1000 European stocks reveals that the largest upward and downward swings are attributable to stocks that maintained on average an odly regular course, upward or downward, throughout the year (with a limited upswing in November for the most badly battered stocks). Furthermore, we find a strong correlation over the course of the year between the relative stock positions and the order of earnings forecasts and margins forecasts. Known for being somewhat far from realities, market participants caught up in the Covid turmoil have on the contrary proven deeply concerned by expected earnings of the companies in the real world and have made their moves in close relation to such expectations. Back to basics then! And prosperous time ahead for fundamental analysts…
Appendix
2020 Change in Rank for Certain Top 50 Stocks
& Change in Rank for 2020 Consensus Normalized Net Income
2020 Change in Rank for Certain Bottom 50 Stocks
& Change in Rank for 2020 Consensus Margin Factor
About Sismo
If this note sparked some interest and made you think, we would love to hear your comments at contact@sismo.fr. This study on the European equity market illustrates the analysis capabilities of Sismo, a visual analytics platform with direct web-access designed for discretionary equity portfolio managers that is integrated with European and US equity coverage from S&P.
Sismo combines innovative visualizations with advanced user interactions to facilitate the reading and understanding of market dynamics, select stocks, define and test investment strategies. It offers innovative screening and back-testing functionalities as well as investment style recognition and marginal portfolio optimization, leveraging on visual analysis capabilities to improve professionals’ investment decisions. Please visit www.sismo.fr.
*
Disclaimer : Past performances are not indicative of future performances. The information in this article is provided for information only and does not constitute, and should not be construed as, investment advice or a recommendation to buy, sell, or otherwise transact in any investment including any products or services or an invitation, offer or solicitation to engage in any investment activity.
[1] For low performing stocks with highly negative net income forecasts in certain cases, it can be expected that a combination of margins on various P&L and Cash Flow items bears more information and is more relevant as a stock driver than a single current year net income forecast.
2,217 total views, 3 views today