
10 January 2022
What could have set them apart? A factor reading of the Eurozone best and worst stocks in 2021 (and the answer is… Quality and Sentiment!)
2021 was a stellar year for Eurozone equities with an average total return of 21.8% for the 605 Eurozone stocks with a market capitalization above €1bn at the beginning of the year. Obviously, certain sectors were favored (Technology, Luxury and Banking) while others, such as Hotels & Restaurants or Real Estate (still) faced adverse market conditions. But beyond their industry, which features differentiated the best from the worst stocks over the course of the year?
A standard factor analysis carried out with Sismo brings a few clues.
The charts below show the average factor profile at 31 December 2020 and at the end of each quarter in 2021 of:
- the top 10% 2021 performers, i.e. the 60 stocks with the highest full-year 2021 total return in our 605-universe of Eurozone stocks (the “Top Portfolio” with the white profile)
- the bottom 10% 2021 performers, i.e. the 60 stocks with the lowest full-year 2021 total return (the “Bottom Portfolio” with the red profile)
The average factor exposure of the 605-universe is reflected by the green dotted line and the scale is expressed in standard deviation from average, with negative (i.e. below average) exposures within the inner disk and positive (above average) exposures in the outer rings. The shadings indicate the dispersion of the two portfolios on each factor (average ± σ).
Factor Profile of the Top (White) and Bottom (Red) Portfolio at 31 December 2020 and at the End of Each Quarter in 2021
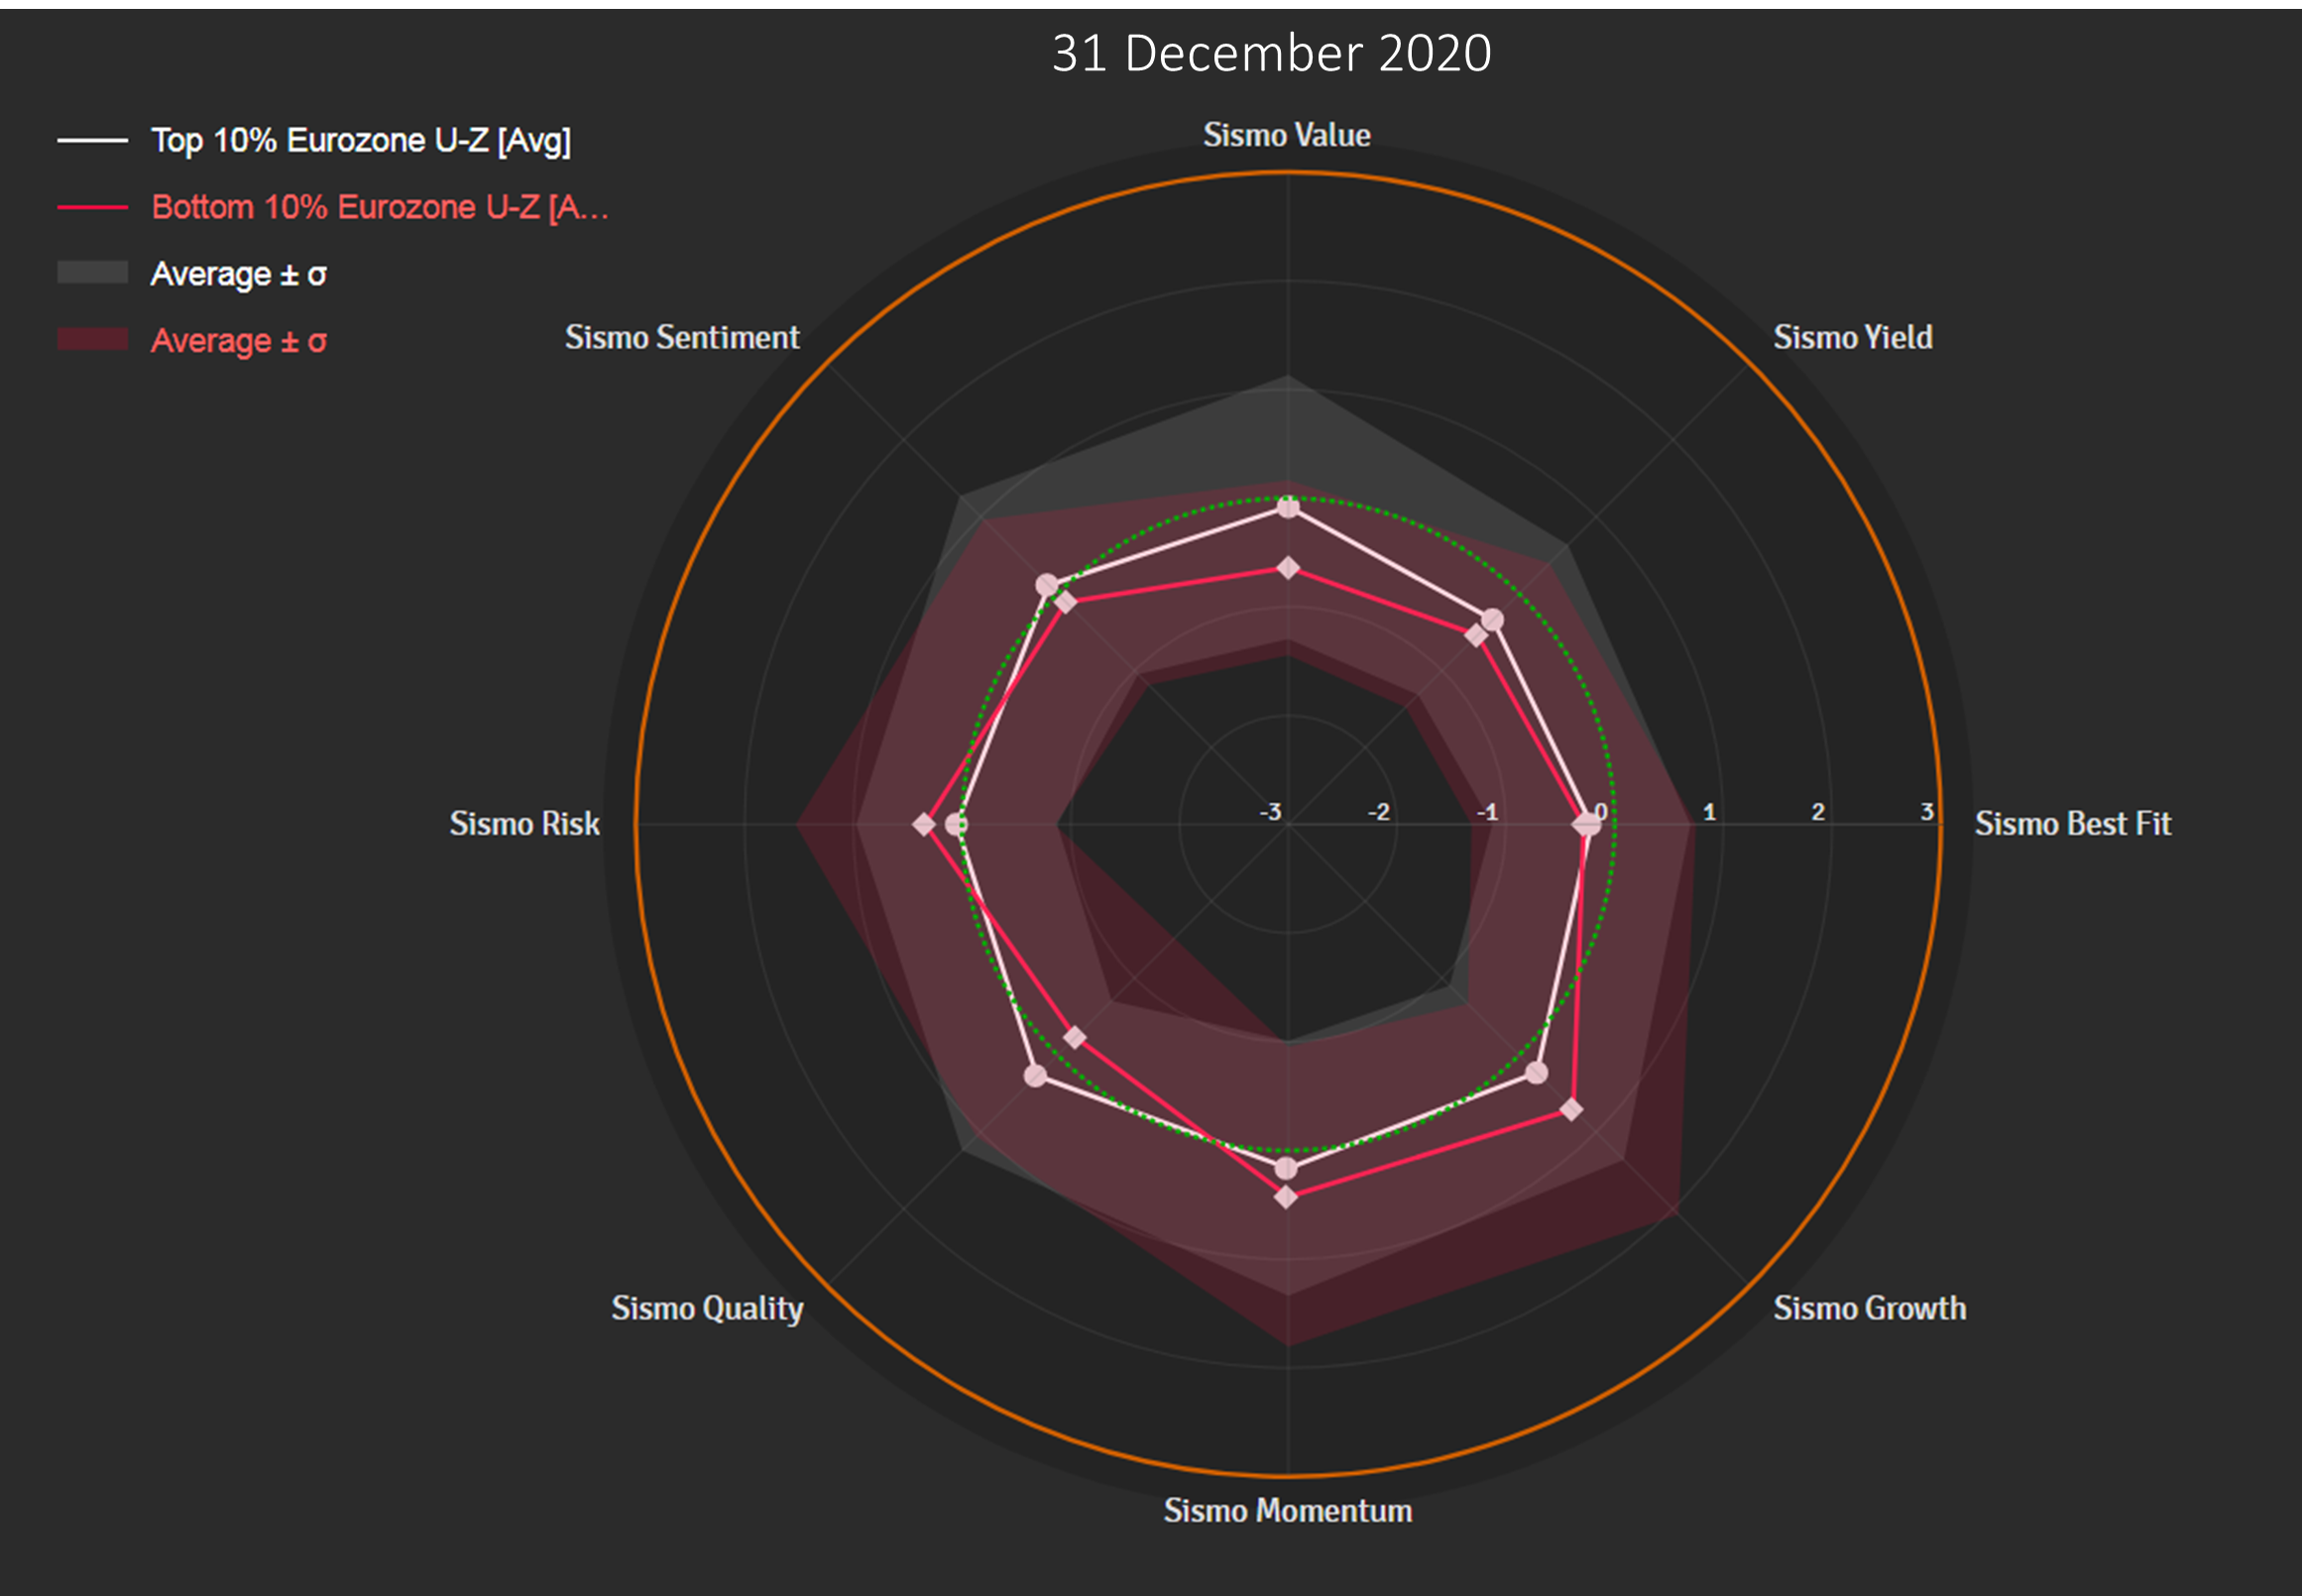
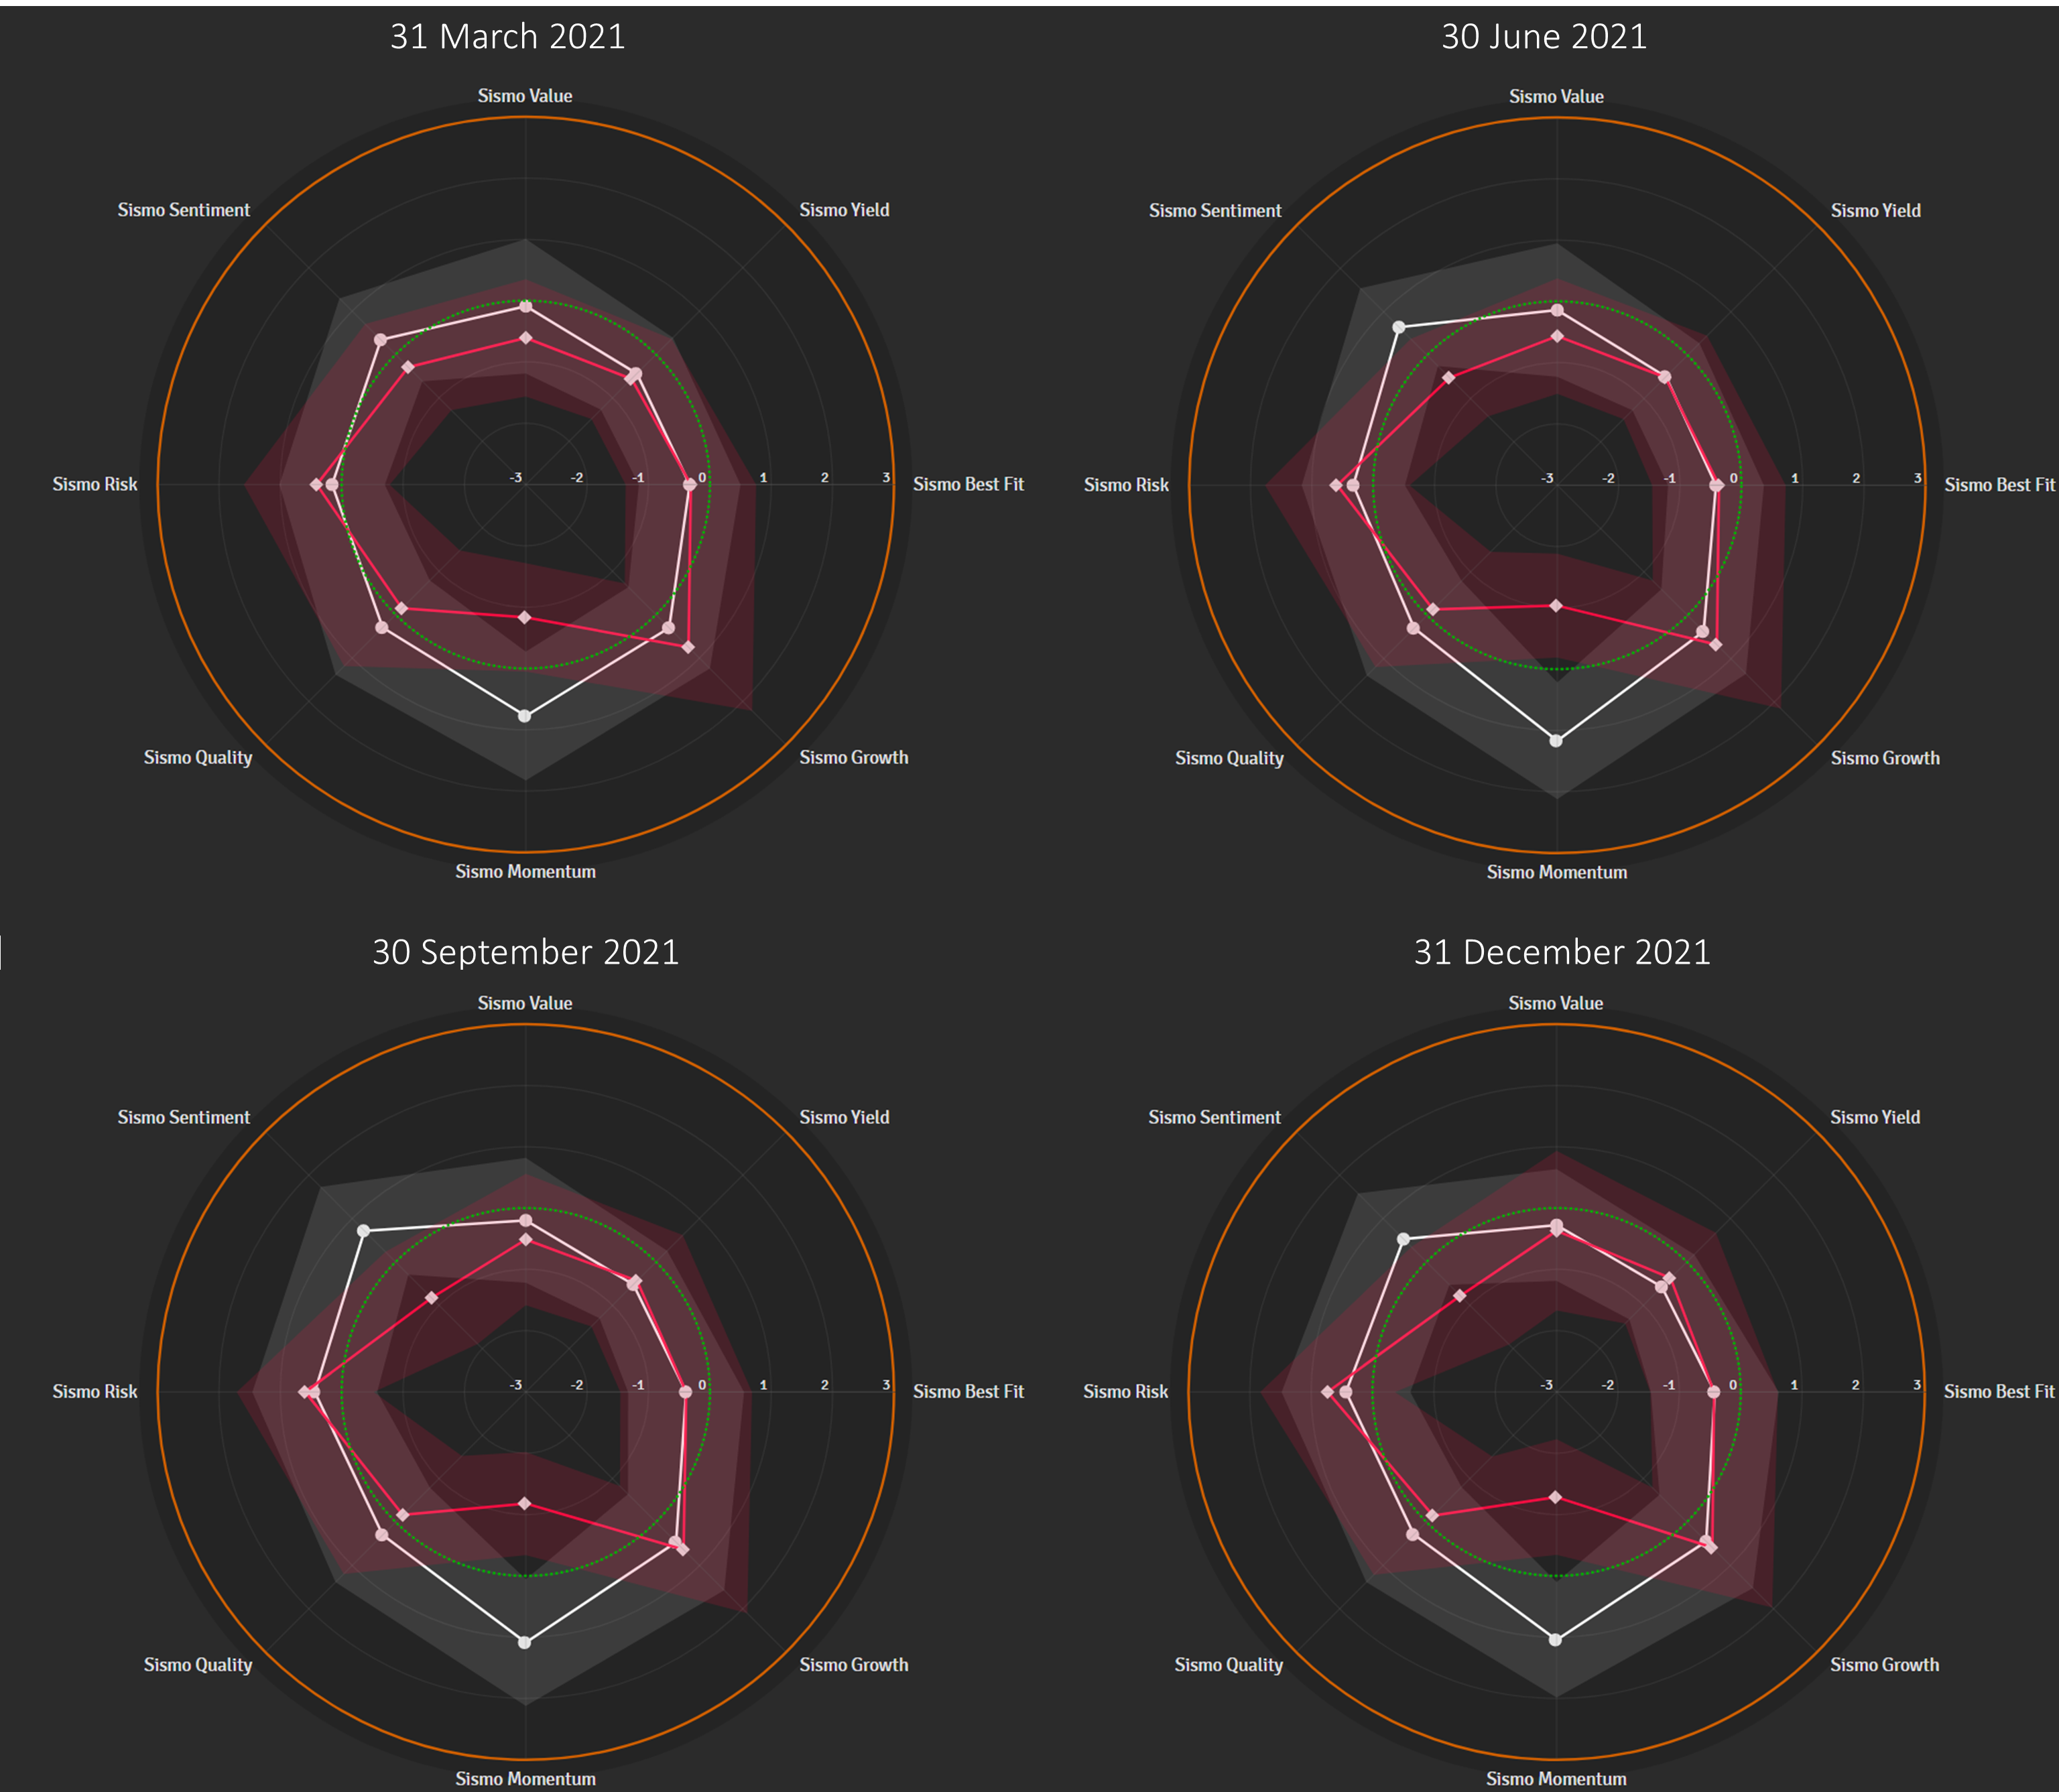
A year ago, at the end of 2020, both the Top and the Bottom portfolios had similar Momentum. The divergence appeared in Q1 2021 and has remained more or less of the same magnitude in the following quarters. Growth, Value, Dividend Yield or Risk do not seem to be differentiating factors ex-ante with no significant gap at 31 Dec. 2020 (nor during the course of 2021). On Quality though, there is a meaningful gap at 31 Dec. 2020 which is confirmed at the end of Q1 2021 when most FY 2020 annual results are published and taken into account: the Top Portfolio exhibits above average Quality exposure while the Bottom Portfolio is below average. In addition, the Sell-Side Sentiment which was only marginally better ex-ante for the Top Portfolio becomes much more distinctive from Q1 2021 onward.
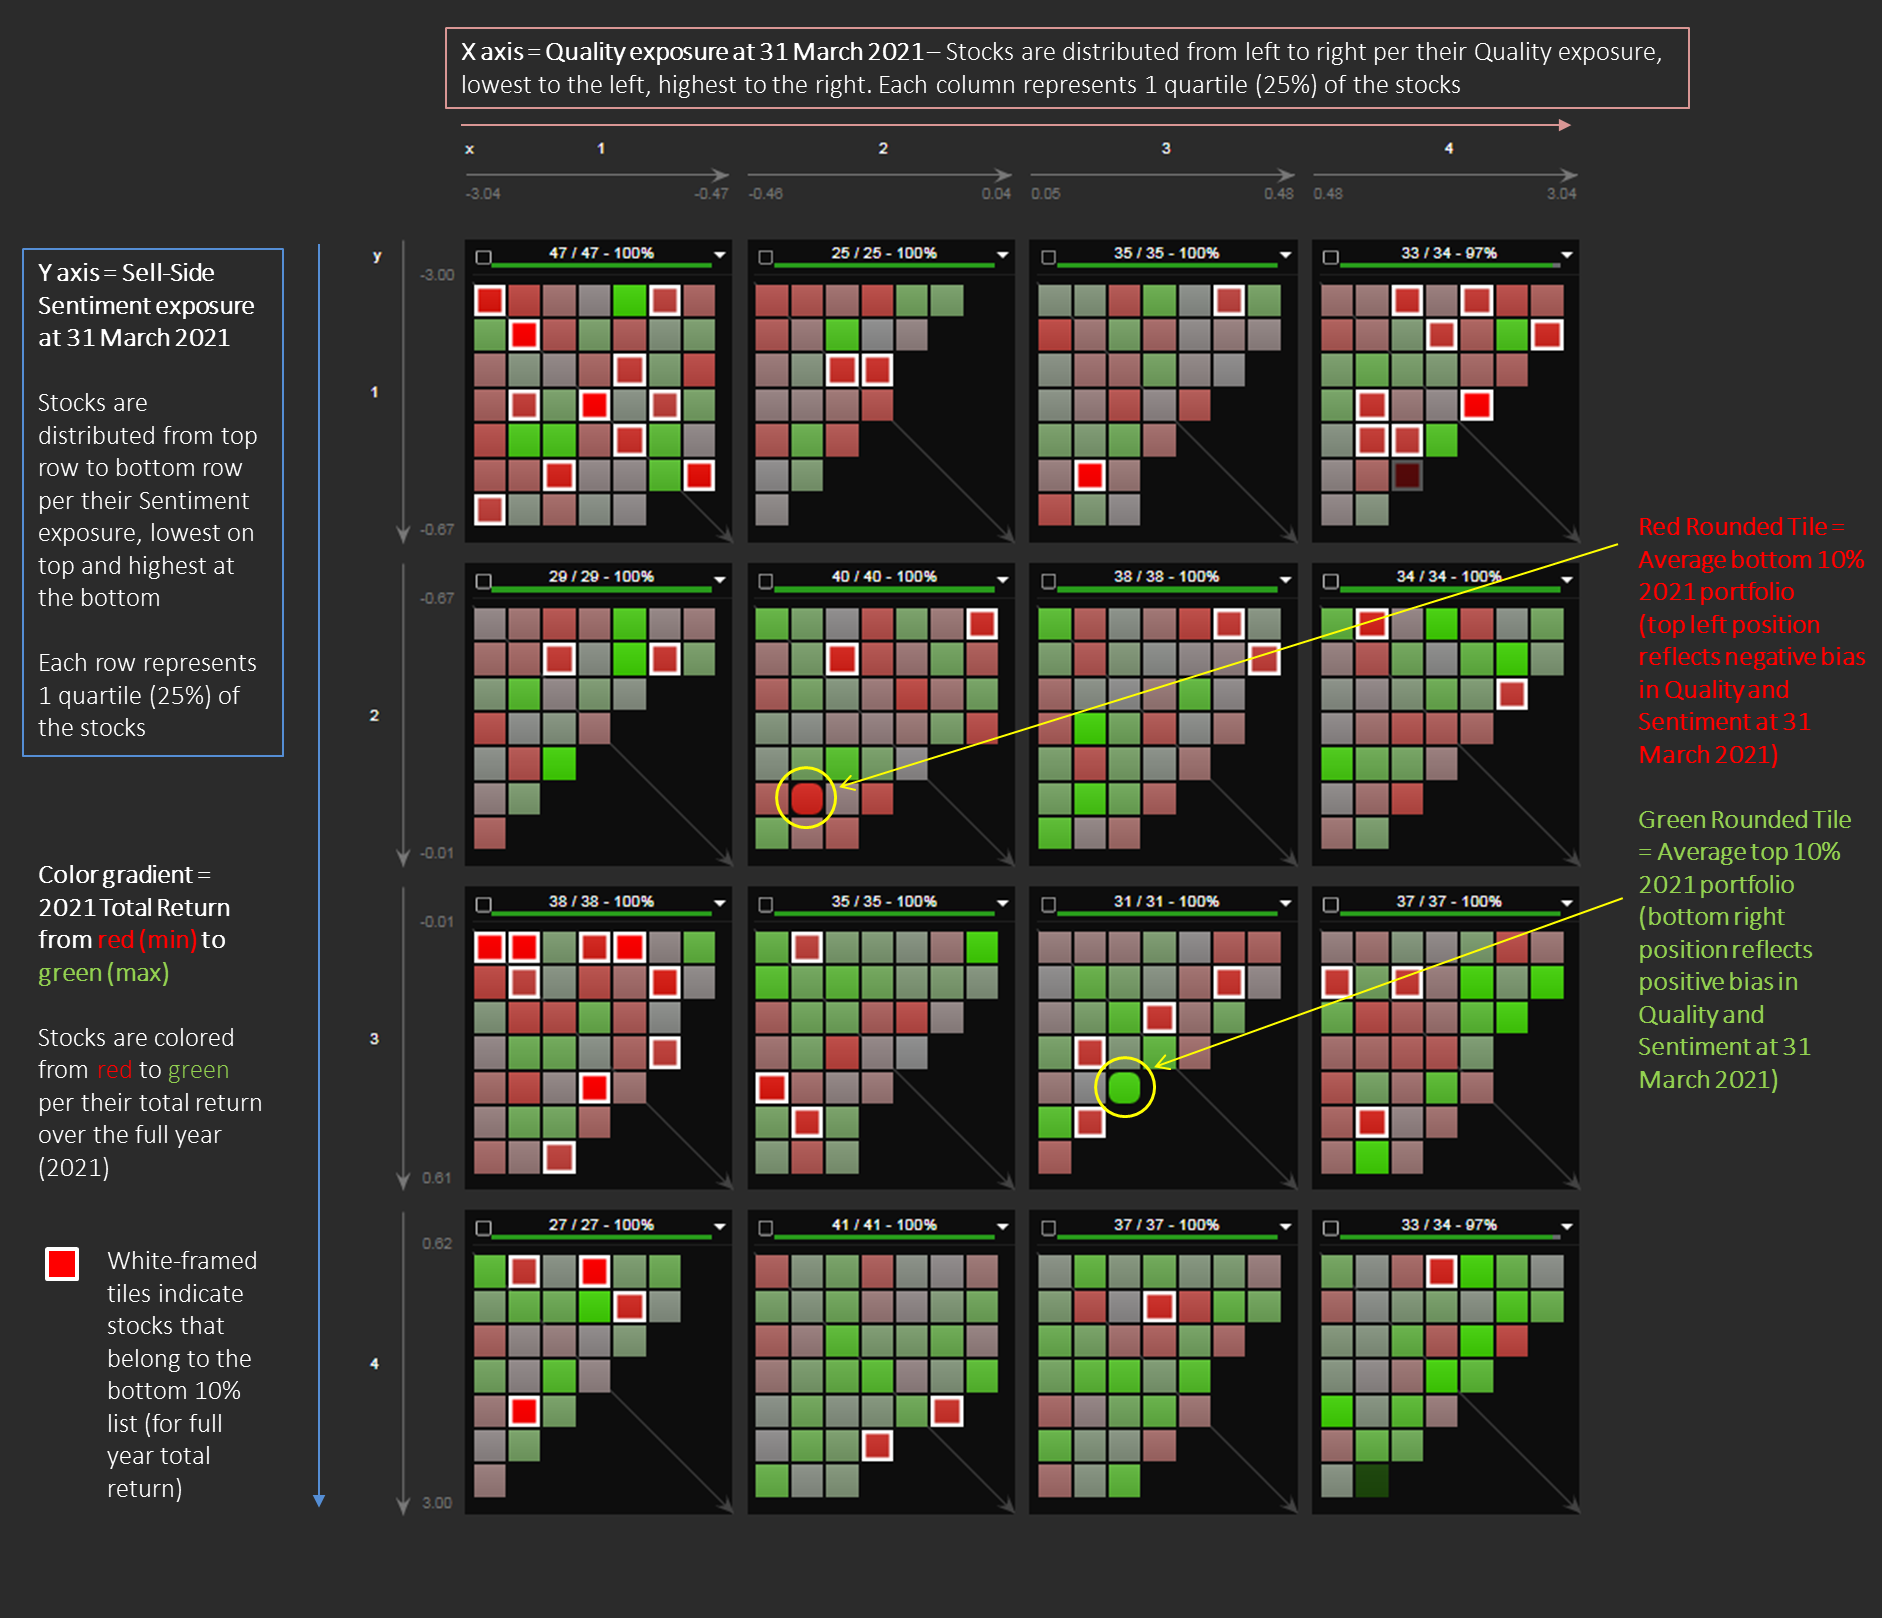
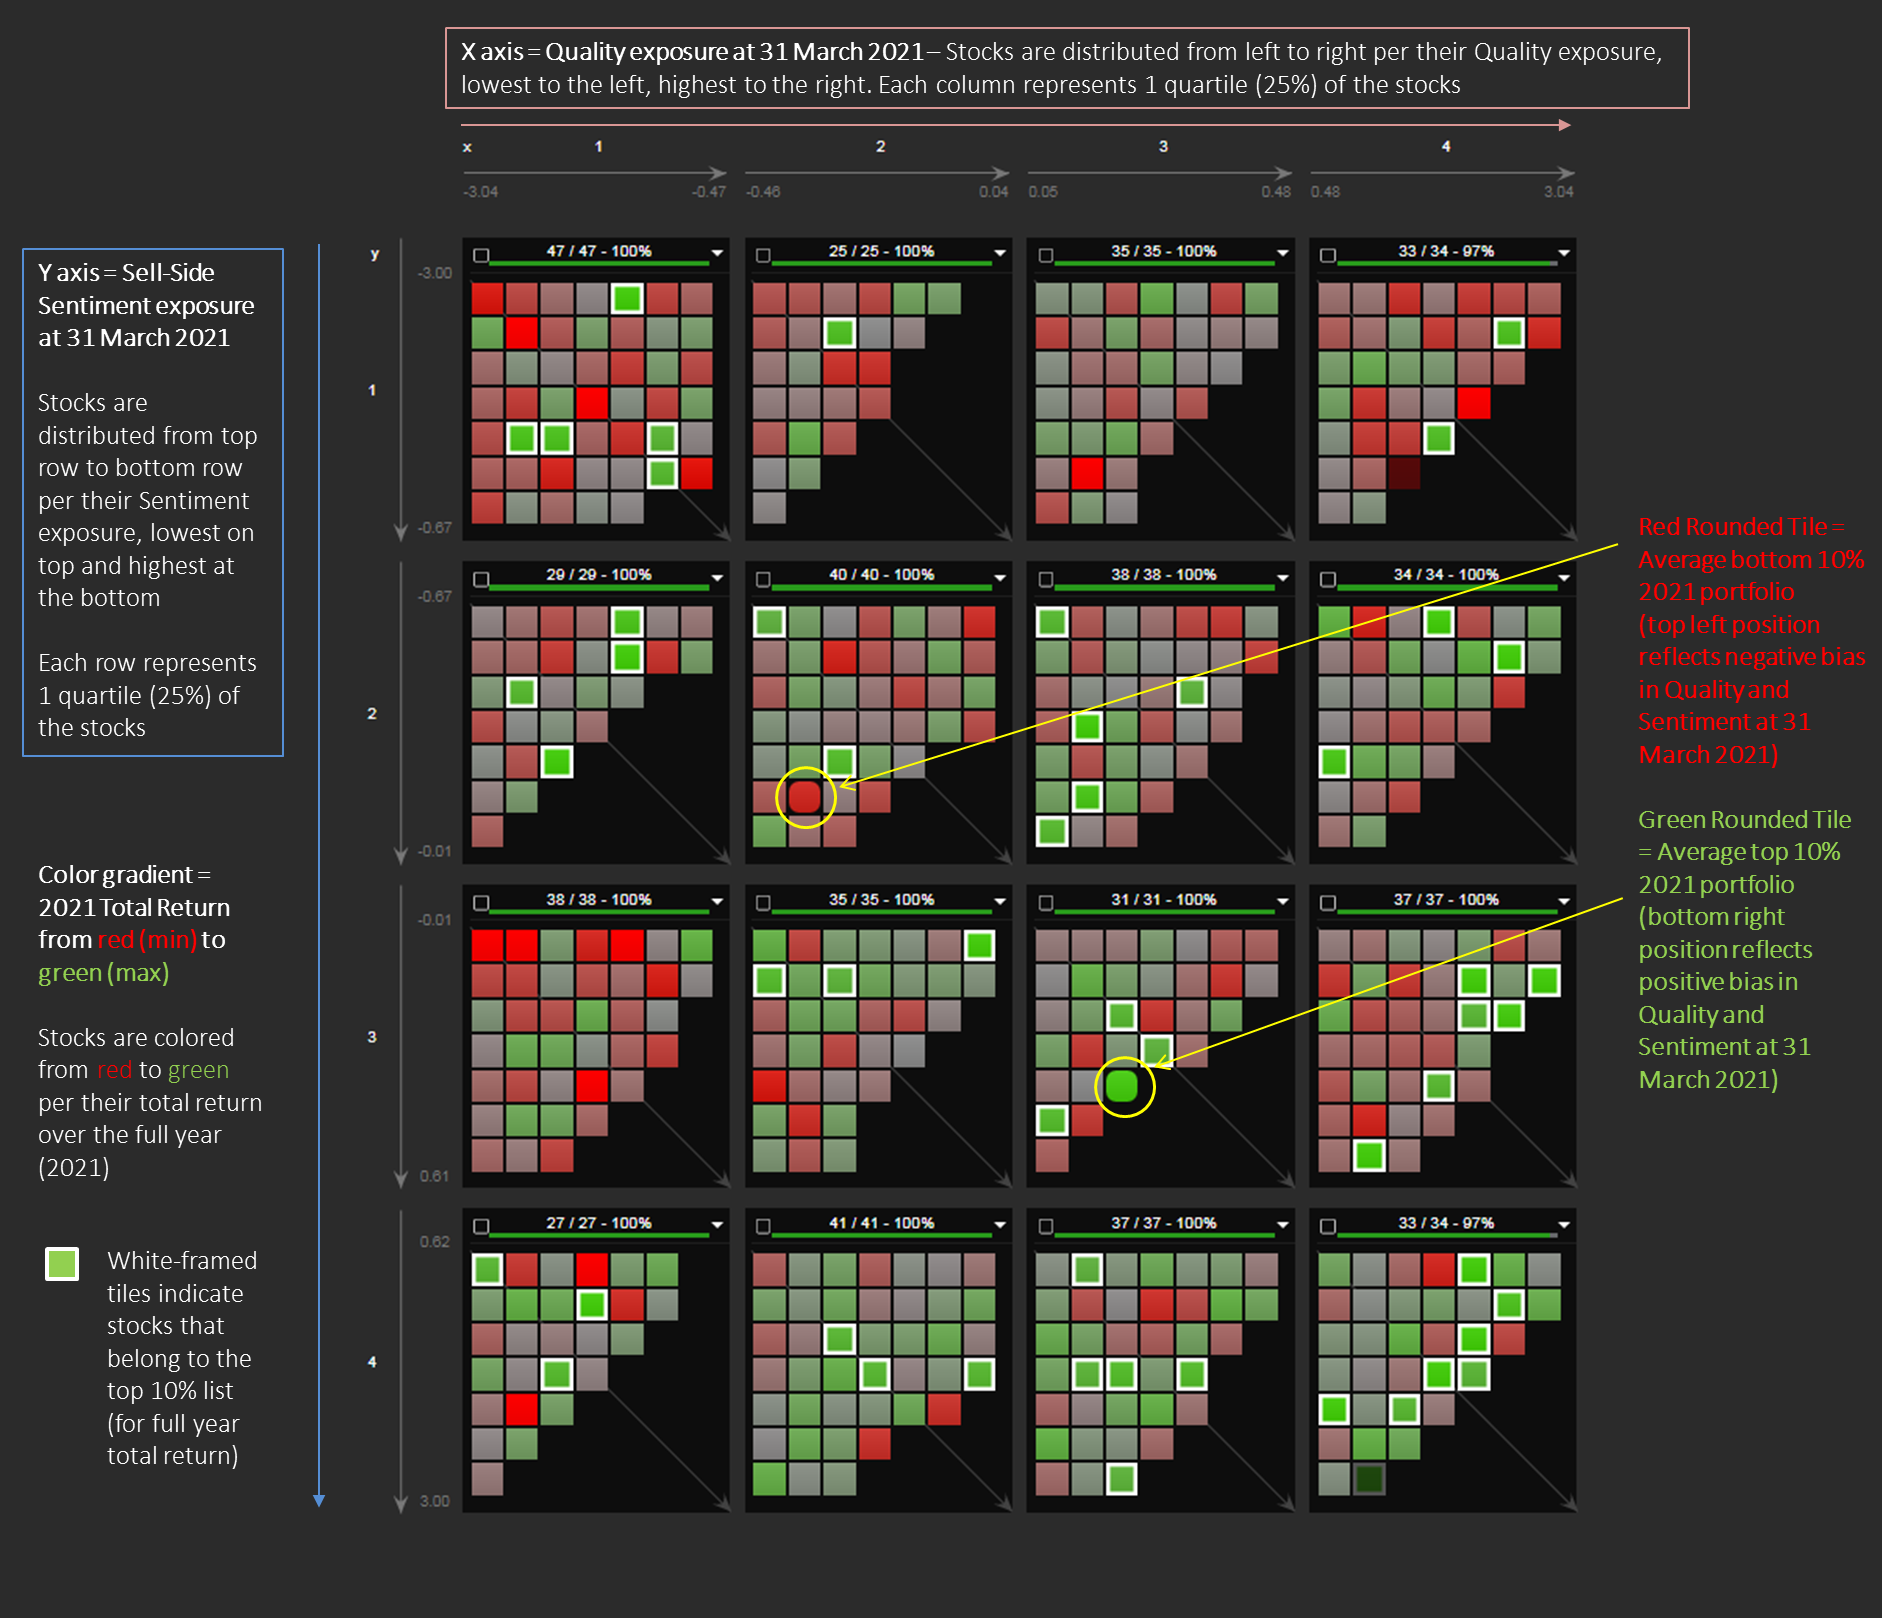
We can check this in another way and visualize the Quality and Sentiment exposures of all 605 stocks ex-ante at 31 December 2020 and add a layer of information reflecting the whole year total return. Here, we choose to do this analysis at 31 March 2021 instead of 31 Dec. 2020 to take into account most FY 2020 annual results in Quality measures and Sell-Side Sentiment.
The 2 charts below are built as follows:
- Quality exposure at the end of March 2021 is reflected by the position on the X axis (highest Quality to the right)
- Sentiment exposure at the end of March 2021 is reflected by the position on the Y axis (highest Sentiment at the bottom)
- Full-year 2021 total return reflected through color gradient from red (lowest) to green (highest)
In addition, we have highlighted (with white frames) the constituents of the 2021 Bottom Portfolio in the first chart and those of the 2021 Top Portfolio in the second chart. The Bottom Portfolio is predominantly distributed in the upper left area of the chart (Low Quality / Low Sentiment at 31 March 2021) while the Top Portfolio stands primarily in the lower right area of the chart (High Quality / High Sentiment at 31 March 2021).
Quality (X axis) & Sell-Side Sentiment (Y axis) Exposure at 31 March 2021 of €1bn+ Eurozone Stocks vs Full-Year 2021 Total Return (Color)
1) Bottom Portfolio Stocks White-Framed
2) Top Portfolio Stocks White-Framed
–
Eurozone equities had a great year in 2021 and exhibited on average a steady and solid performance. However, two factors proved in retrospect especially relevant in differentiating a year before and at the beginning of 2021 the stocks that, in the end, were to offer the best (or the worst) full-year performance to investors:
- Quality (here defined as a combination of high historical returns on equity and capital employed and low leverage)
- Sentiment (here defined as a combination of change in analysts’ target price and recommendation in recent months as well as current recommendation level)
Equities are stories, each one is different and duly deserves the full attention of the fundamental investor. However, certain stories exhibit common features and factor analysis offers an easy way to find them out and use them (or not, but knowingly!) in investment management.
Please get in touch for further information.
–
About Sismo
If this note sparked some interest and made you think, we would love to hear your comments at contact@sismo.fr. This study on the European equity market illustrates the analysis capabilities of Sismo, a visual analytics platform with direct web-access designed for discretionary equity portfolio managers that is integrated with global equity coverage from S&P.
Sismo combines innovative visualizations with advanced user interactions to facilitate the reading and understanding of market dynamics, select stocks, define and test investment strategies. It offers innovative screening and back-testing functionalities as well as investment style recognition and marginal portfolio optimization, leveraging on visual analysis capabilities to improve professionals’ investment decisions. Please visit www.sismo.fr.
2,396 total views, 1 views today