
10 April 2020
When Value bounces back: U-turn or inverted mirror?
The Dow Jones index has just recorded its best week since 1974, posting a gain of +12.7% in four days as markets are closed today for Easter. European markets have followed a similar course.
To get a sense of which segment drove this market rally, we can look at the performance of individual stocks and sectors (that’s awfully easy to visualize in Sismo!) but factor analysis proves to be an original and powerful tool to investigate market internals.
In previous posts (such as this one or that one), we grouped stocks together according to their ex-ante exposure to some of the well-known academic factors and looked at their ex-post performance during the following period. Here, we take the opposite approach:
1) we group stocks into 4 quartiles according to their realized performance over the period
2) we look at the average factor profile of each quartile at the beginning of the period to see if stocks within each quartile shared similar characteristics initially
The left-side chart shows the average factor profile of the top 25% (white) and bottom 25% (red) performers between 31 Dec. 2019 and 23 Mar. 2020 (the trough of the market) for the largest 600 European stocks. The right-side chart exhibits the same information for the top (white) and bottom (red) performers during the last week.
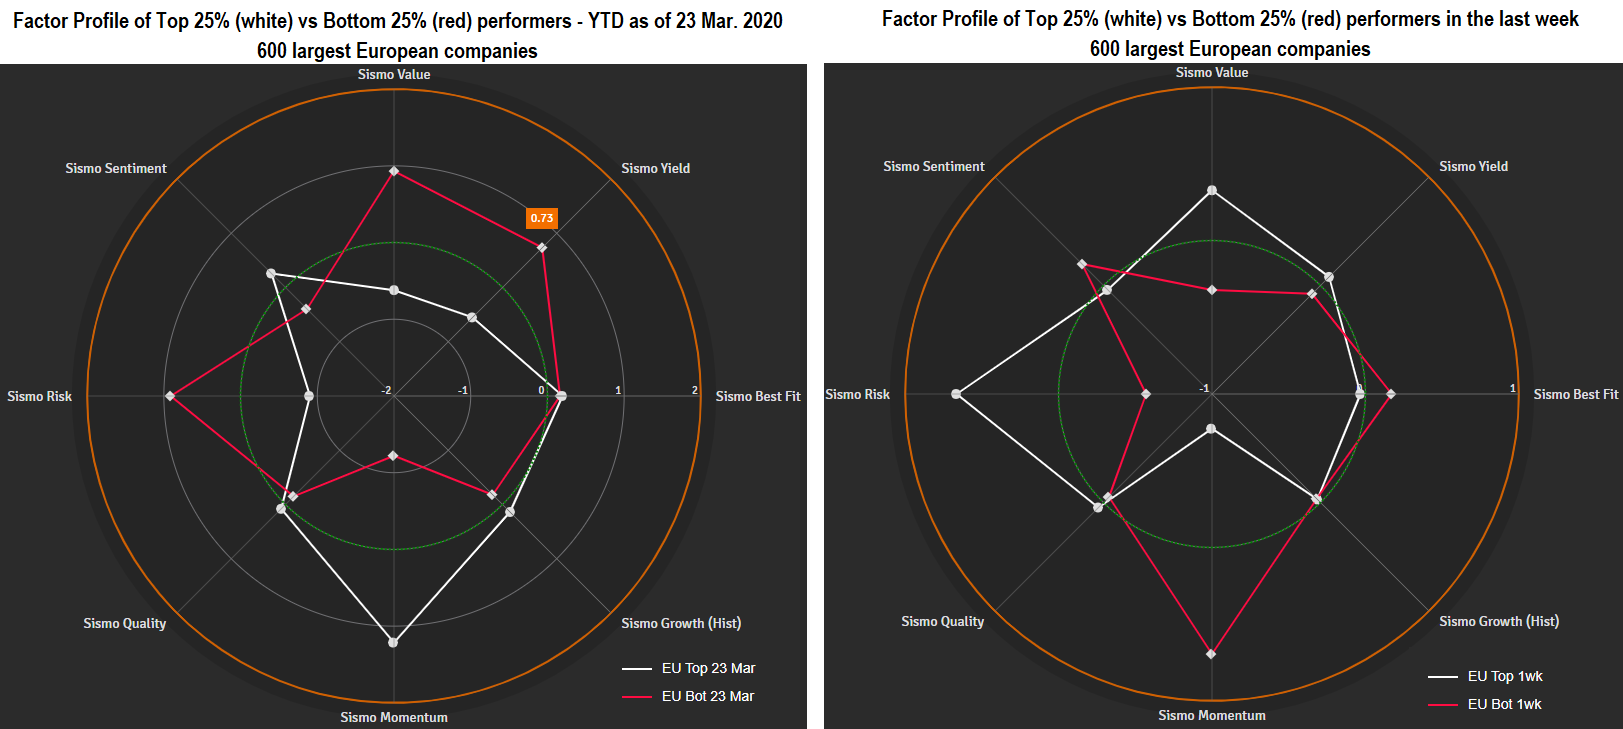
It almost feels like the white and red colors have been inverted on these two charts!
During the drawdown phase (left side), the worst performers (in red) had very high exposure to Value (ie. cheap stocks) and Risk factors while the best performers (in white) were expensive low vol stocks. The situation reversed dramatically in the last week with Value/Risk stocks rebounding sharply (white line).
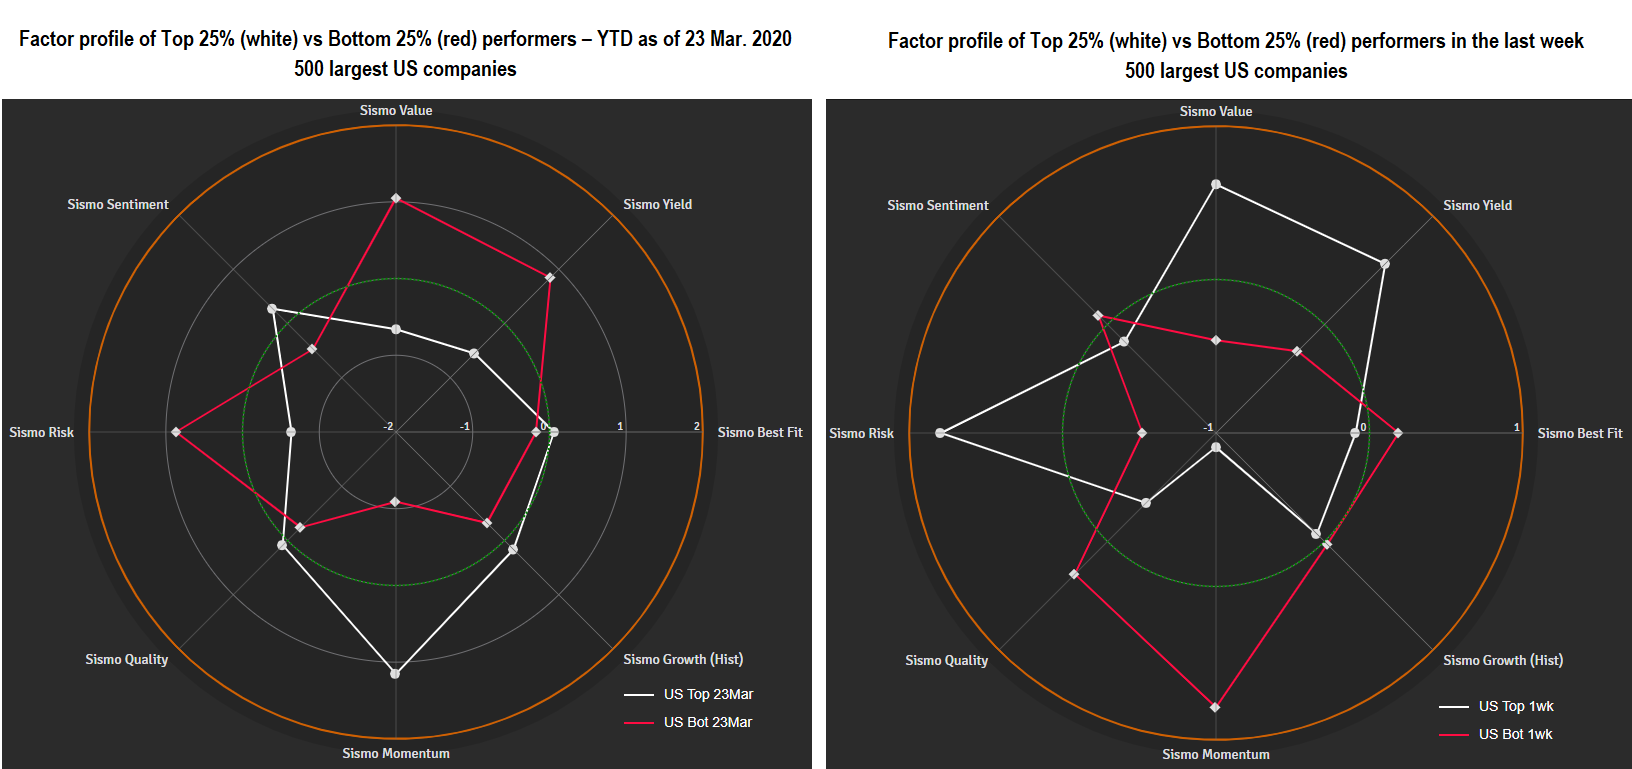
The exact same observations can be made in the US as can be seen in the charts below.
What do we take from this?
While equity markets unwisely ignored the Covid impact in January and early February when it was mostly confined to China, their reaction from late February to Mid-March has been sudden and brutal, sweeping everything in their path and burying Value and Risky stocks in extreme market moves. The last three weeks have seen a large offsetting effect whereby Value and Risky stocks bounced back nearly as violently as they had been crucified in the previous month. What’s next then? Could this be the moment for active investment to step in and differentiate stocks one by one on their fundamentals? A much sought-after moment, as passive investment kept gaining ground in the recent downfall…
We will watch carefully and share our findings soon!
2,299 total views, 1 views today