04 May 2020
Hedge Funds Stock Picking Darlings: High-Quality Stocks at the Risk of Overcrowding (Part I)
Please see important disclaimer at the end of the page
Recently, Barron’s published an interesting article on how the favorite stocks of US hedge-funds fared in the current market environment. The article is based on the findings of Lori Calvasina, Head of US equity strategy at RBC, who has combed through 13-F SEC filings from large institutional investors and hedge funds.
Out of 721 public disclosures of US equity hedge funds benchmarked to the S&P 500 or the Russell 1000 indices, Lori compiled two lists:
- the 20 stocks that were most frequently held by hedge funds at the end of 2019
(the “Lions of Large Cap”) - the 20 stocks with the largest amount of dollars invested (the “Hedge Fund Hot-Dogs”).
Her review concludes that both lists performed on average better than their benchmarks in 2020. In particular, the “Hot-Dogs” list beat the Russell 1000 by a significant margin.
RBC Capital Markets Hedge-Funds Hot-Dogs List
This blog post takes a closer look at the performance and factor profile of the above hedge-funds Hot-Dogs, relying on Sismo’s analytical and data visualisation features.
In a subsequent post, we will explain how investment professionals can find stocks that are similar to Hot-Dogs – but in a somewhat less crowded market environment – using Sismo’s factor peer search.
1. Relative performance of the Hedge-Funds Hot-Dogs list
In Q1 2020, hedge-funds beloved stocks have indeed outperformed the principle US equity indices. We measured total returns with a Sismo back-test on the Hot-Dogs portfolio, rebalancing it weekly to maintain a 5%-equal weight scheme for each of the 20 stocks over the first quarter of 2020. The portfolio lost 13.5% while the S&P 500 and the Russell 1000 were down 20%.
Q1 2020 Performance of the Hedge Fund Hot-Dogs and S&P 500/Russell 1000
To break down this outperformance at individual stock level, we first created a universe of 1000 US stocks as a proxy to the Russell 1000 using Sismo Universe Builder.
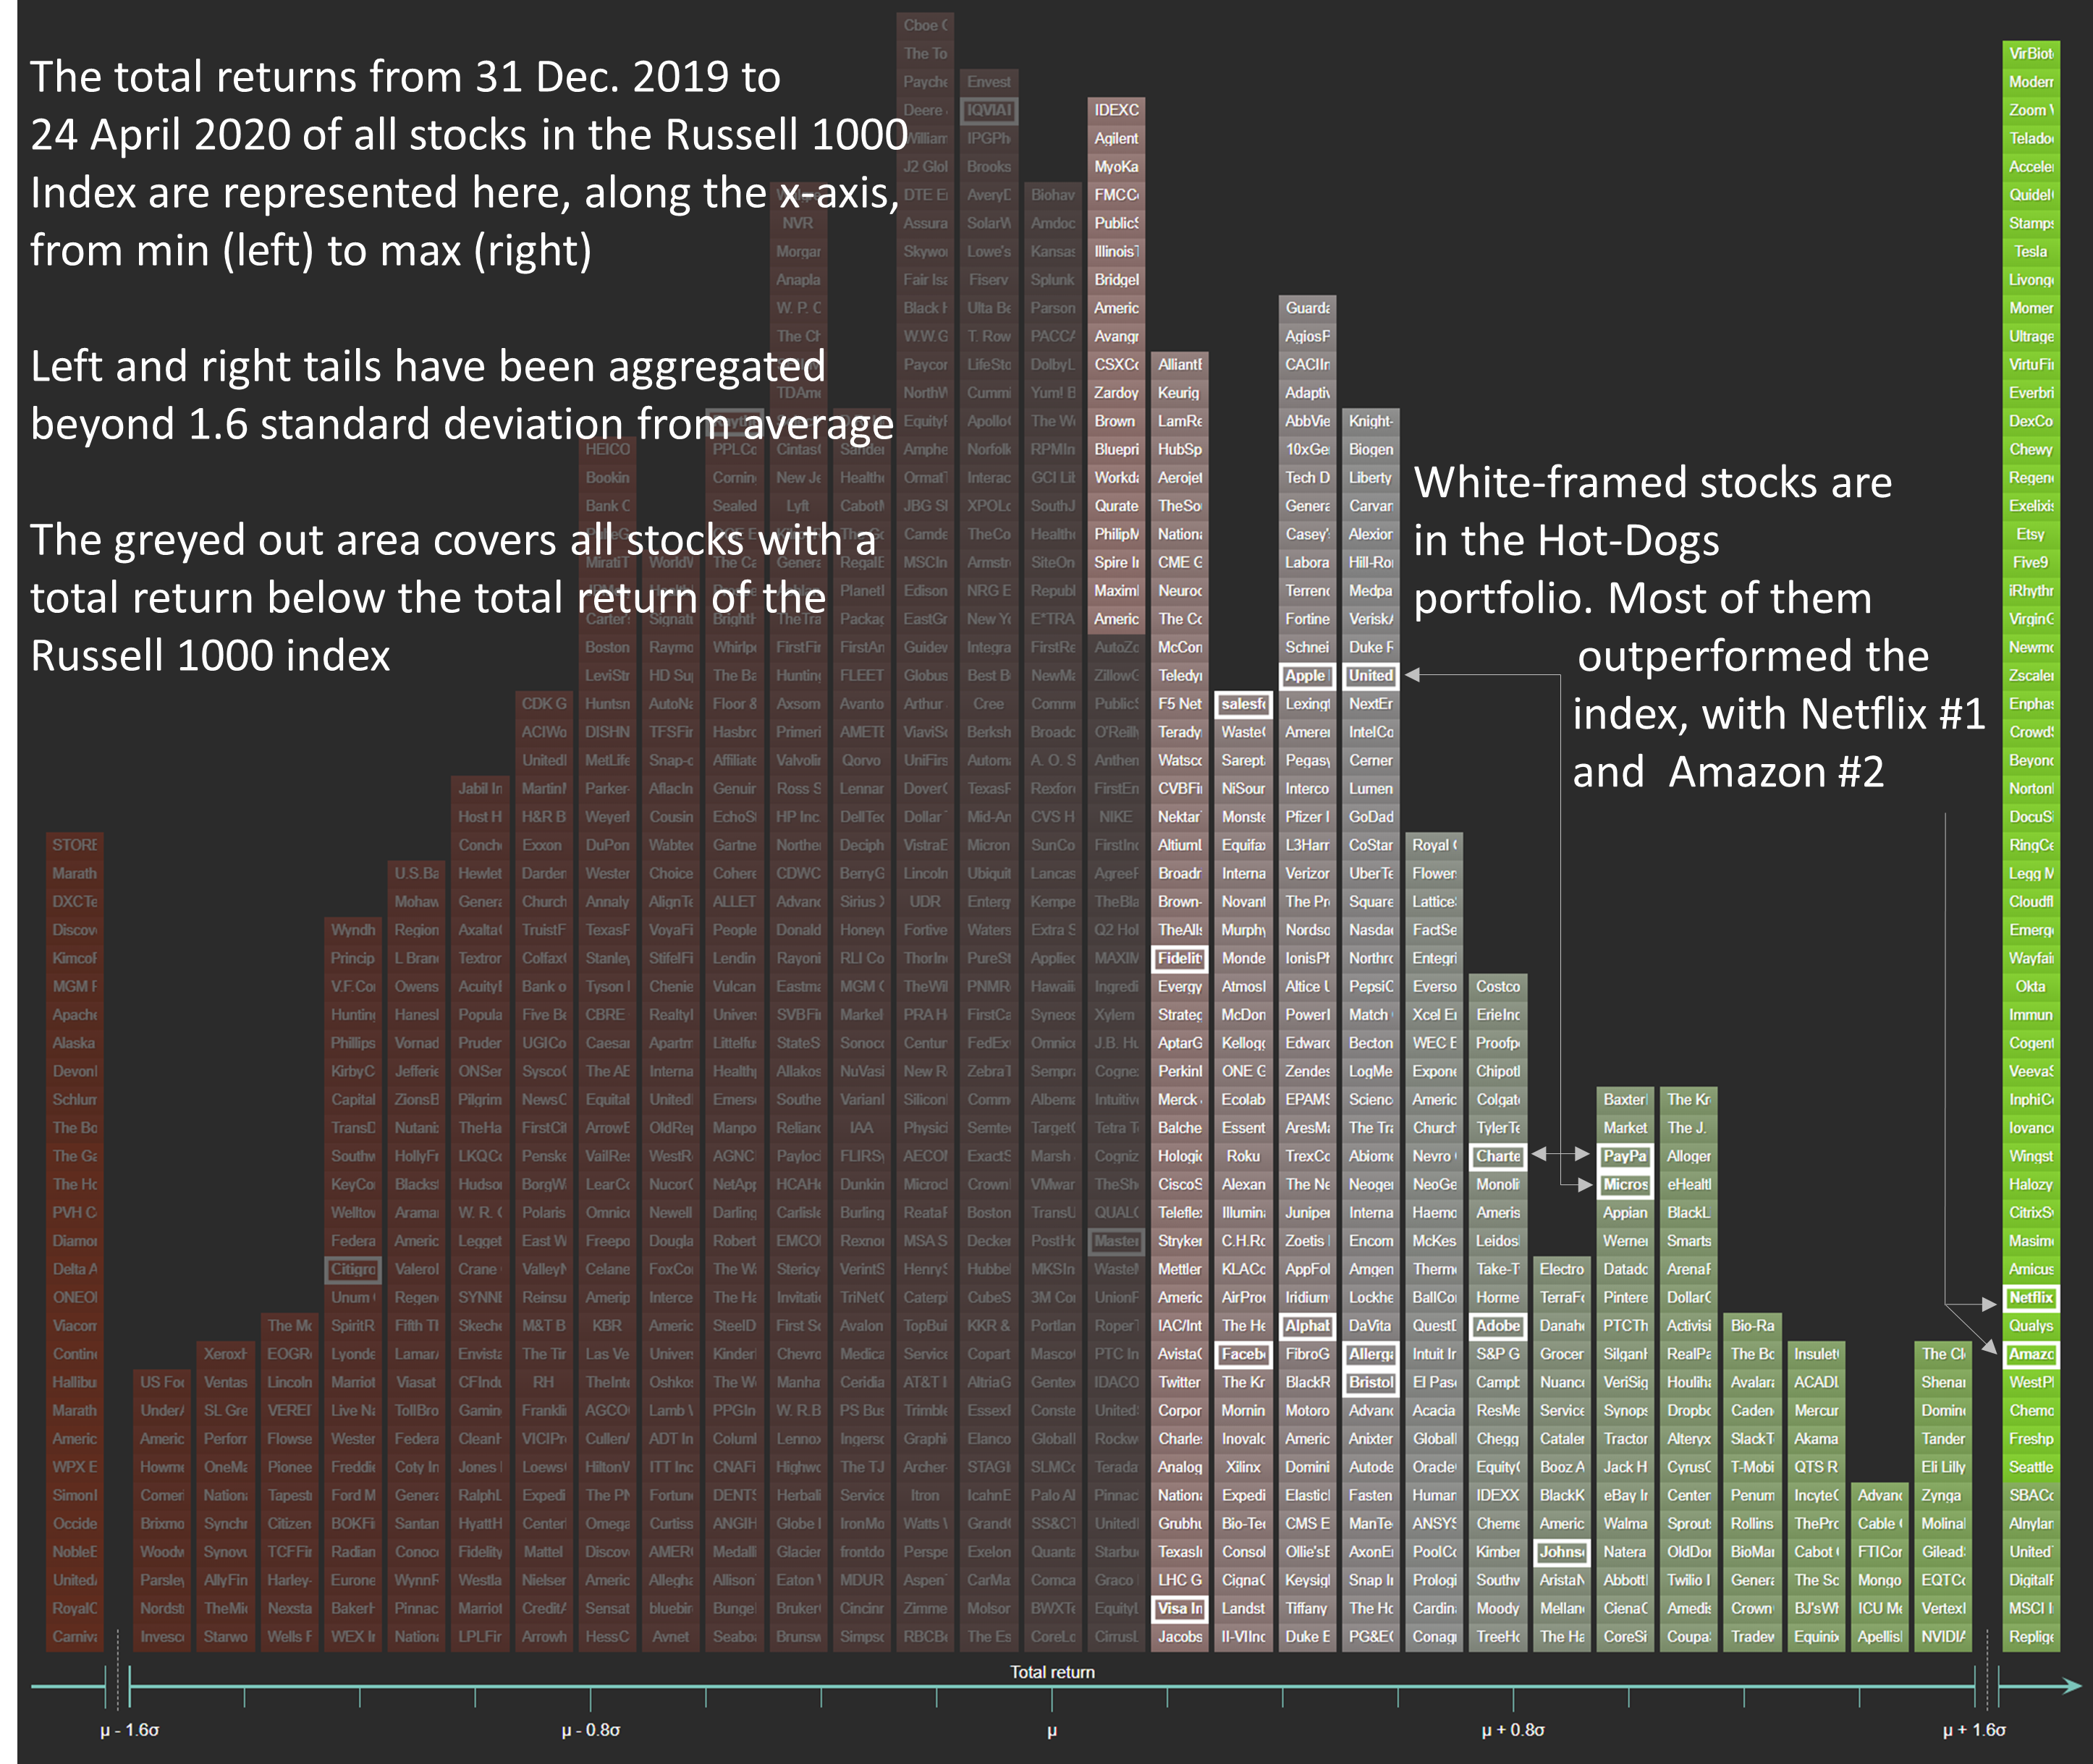
Sismo instantly calculates and brings up the display of the whole distribution of year-to-date (“YTD”) total returns for this Russell 1000 proxy universe. In the chart shown below, each small rectangle tile represents a stock in the universe and the tiles are distributed from left to right according to their YTD returns as of 24 April 2020.
The greyed-out area on the left covers stocks which underperformed the Russell 1000 (‑11.98%).
We have highlighted Hot-Dogs stocks with a white-framing. The vast majority of Hot-Dogs (17 out of 20) outperformed the Russell 1000, led by Netflix (+31.3% YTD) and Amazon (+30.4%). The 3 underperformers in the list (white-framed and standing in the greyed-out area) are notably Citi (‑45.7%) and Raytheon (-27.8%), and to a lesser extent IQVIA (-16.6%). The average performance of Hot-Dogs year-to-date is -2.39%, or a staggering +9.59% outperformance with respect to the overall market. Surely, hedge funds positioned on such long leg were at an advantage when this unexpected crisis burst into the scene!
Top 1000 US Stocks Total Returns: 31 Dec. 2019 to 24 Apr. 2020
2. Looking at the common features of Hedge-Funds Hot-Dogs
What explains the resilience of these stocks in downturn? To answer this question, we use another tool available in Sismo: Factors.
In a nutshell, Factors are composite indicators giving a synthetic view of multiple financial indicators, all at once. For example, a Value Factor can be defined as a combination of Price-to-Earnings, Price-to-Book and EV/Ebitda indicators. A high exposure to the Value Factor indicates that a stock is relatively cheap with respect to other stocks in the Russell 1000 index. Similar combinations can be defined for other investment styles or risk measures, such as Growth, Momentum, etc.
Note that in Sismo, portfolio managers can define the specific factors that are relevant to their own investment objectives (in the form of a weighted linear combination of financial indicators) or, alternatively, use the off-the-shelf Sismo-defined factors.
Below is a brief description of each Sismo Factor (for complete description, see related post)

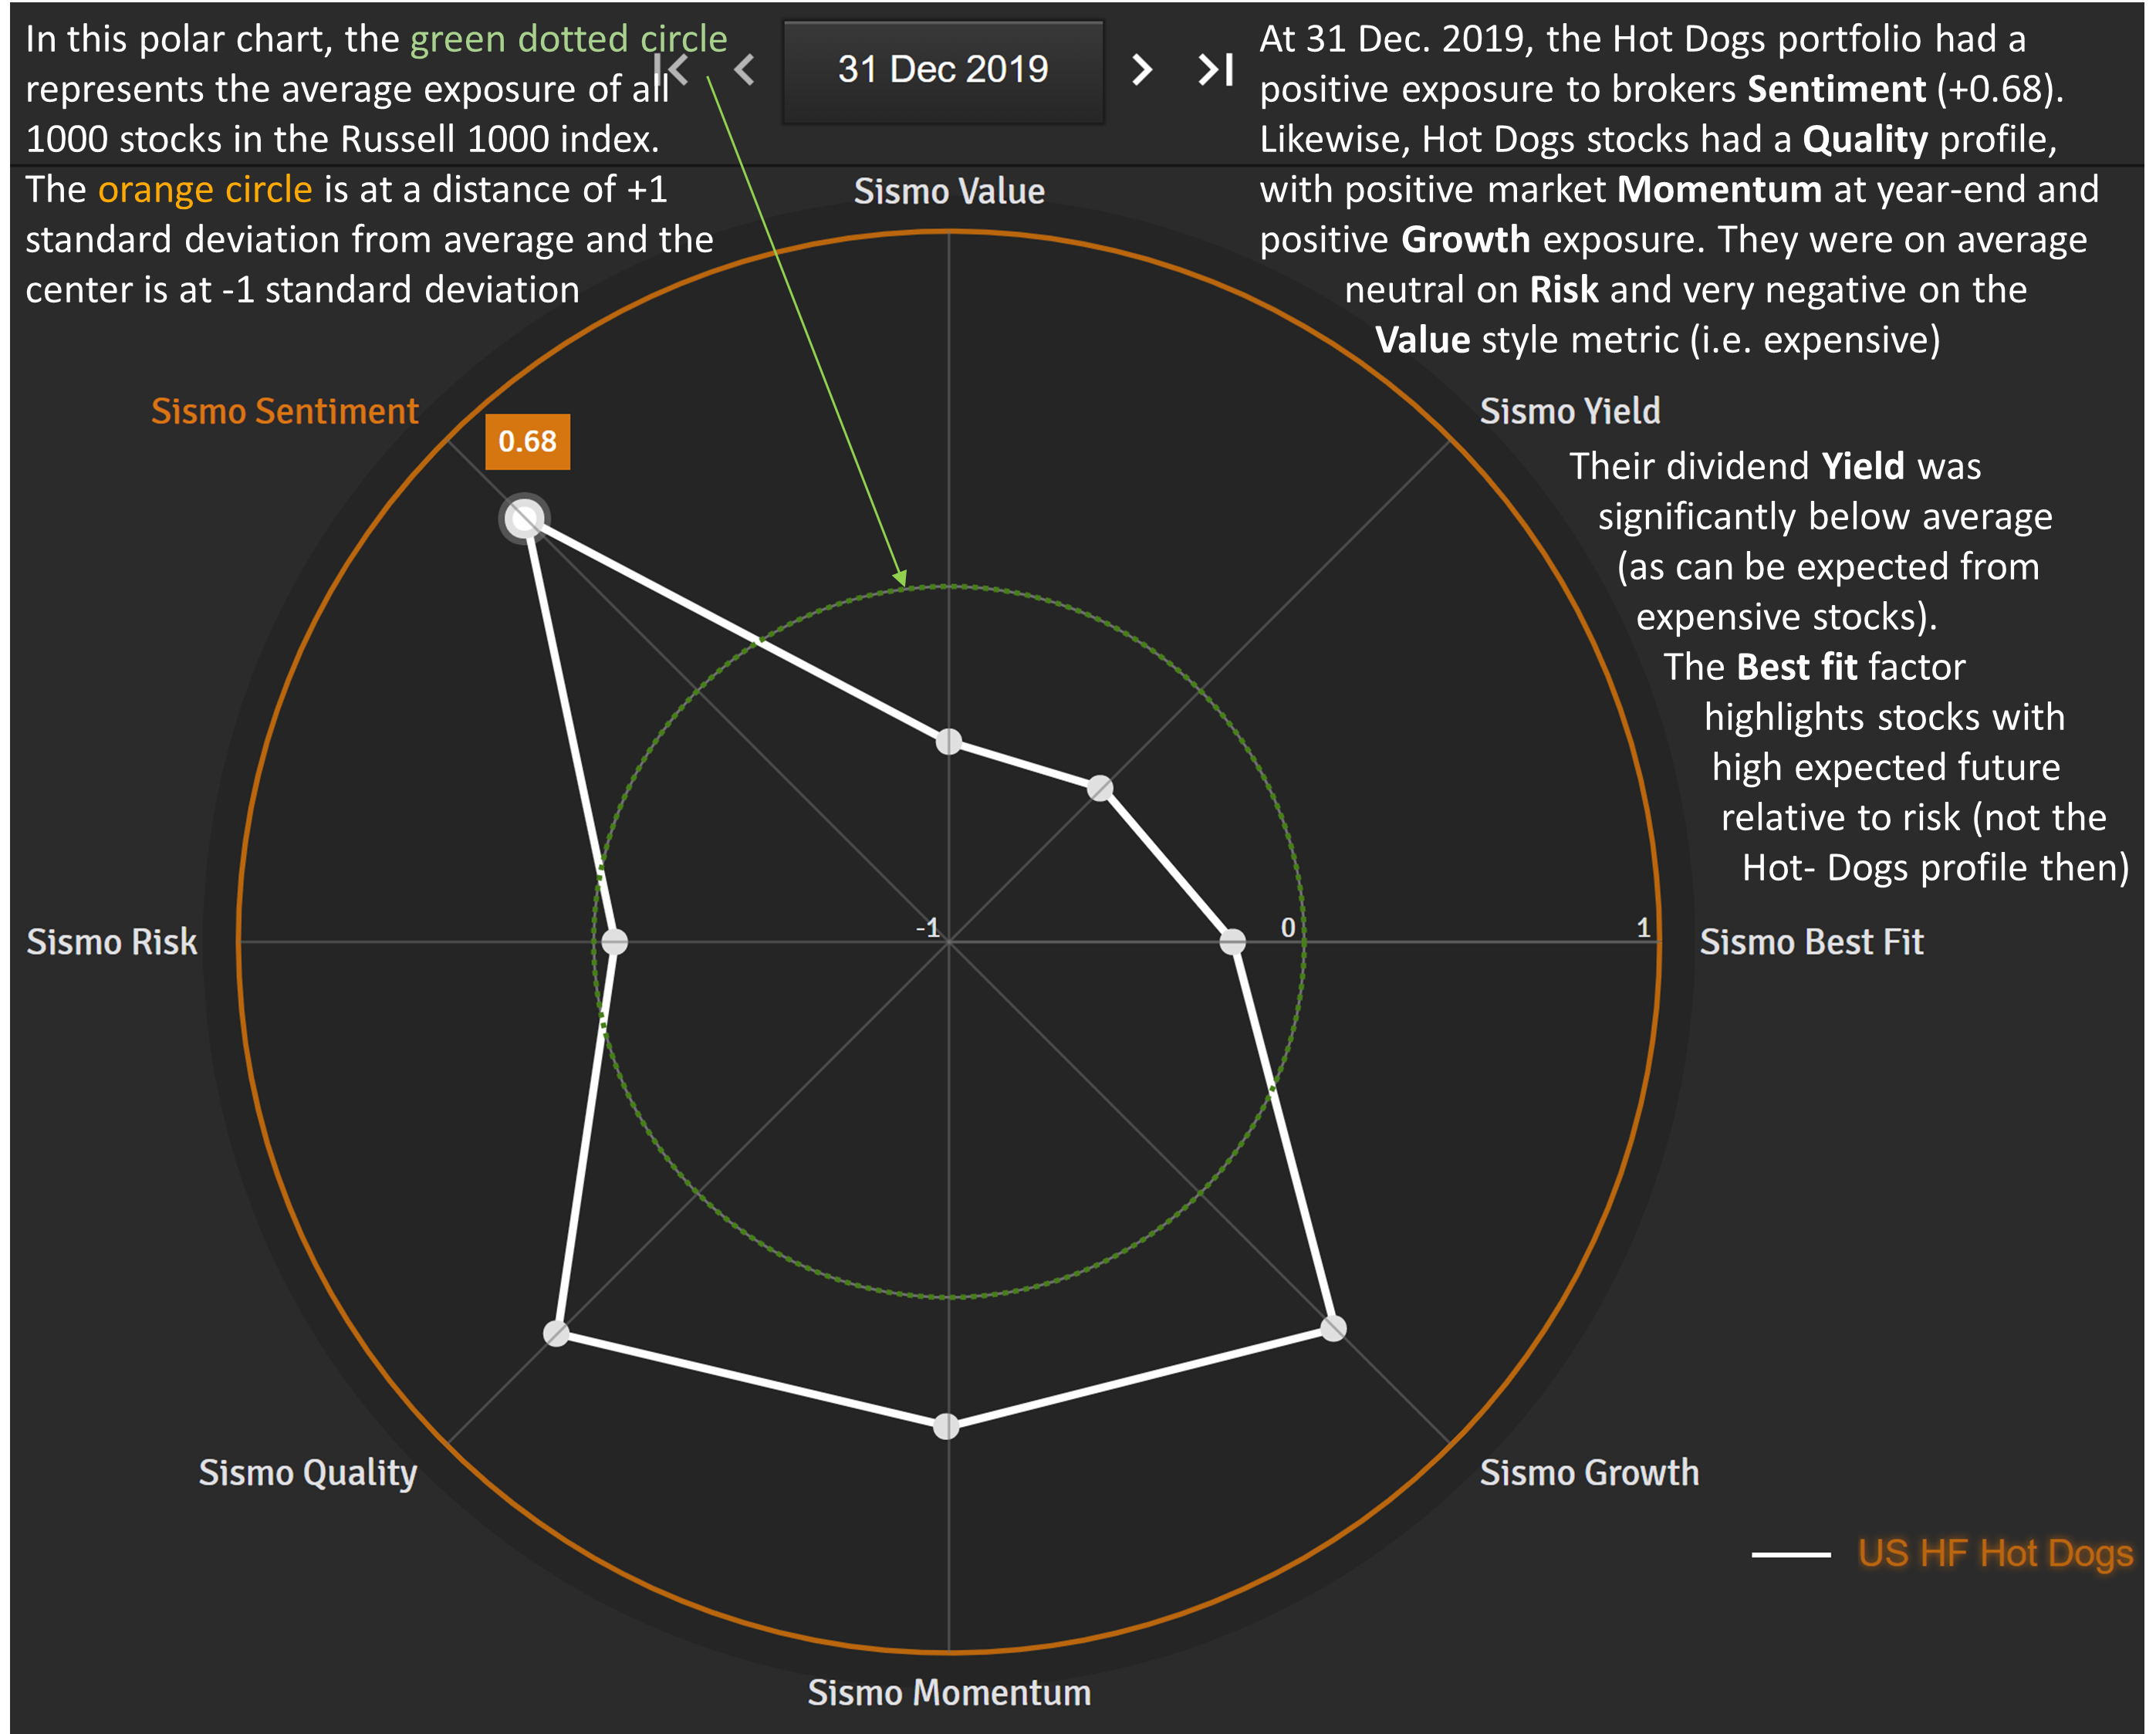
We measured such factors at 31 Dec. 2019 on each stock in our universe of 1000 US stocks and aggregated individual exposures to highlight the average profile of the Hot-Dogs list. As noted in Barron’s article, the main features of Hot-Dogs stocks are (i) above-average Quality, (ii) below-average Risk, (iii) below-average Value (i.e. rather expensive), (iv) above-average sell-side Sentiment. As was discussed in detail in a previous Sismo blog post, those were winning characteristics in the recent market turmoil.
Average Factors Exposures at 31 Dec. 2019 of Stocks in the RBC Hedge-Funds Hot-Dogs List
While hedge funds’ favorite long positions exhibited a very resilient performance in the recent downturn, investment managers could now legitimately be concerned by:
- the level of past outperformance of the Hot-Dogs stocks (high Momentum);
- the extreme bullish Sentiment from the sell-side (high Sentiment);
- the positioning of competing hedge funds holding the same long positions.
These considerations could be deemed to constitute warning signs of overcrowding, assuming a sequence whereby bullish investors would have been buying along the rally, chasing the momentum fueled by sell-side optimism, thus exposing stocks to possible reversals when the buying capacity is absorbed.
3. Current sell-side optimism is highly correlated to market action
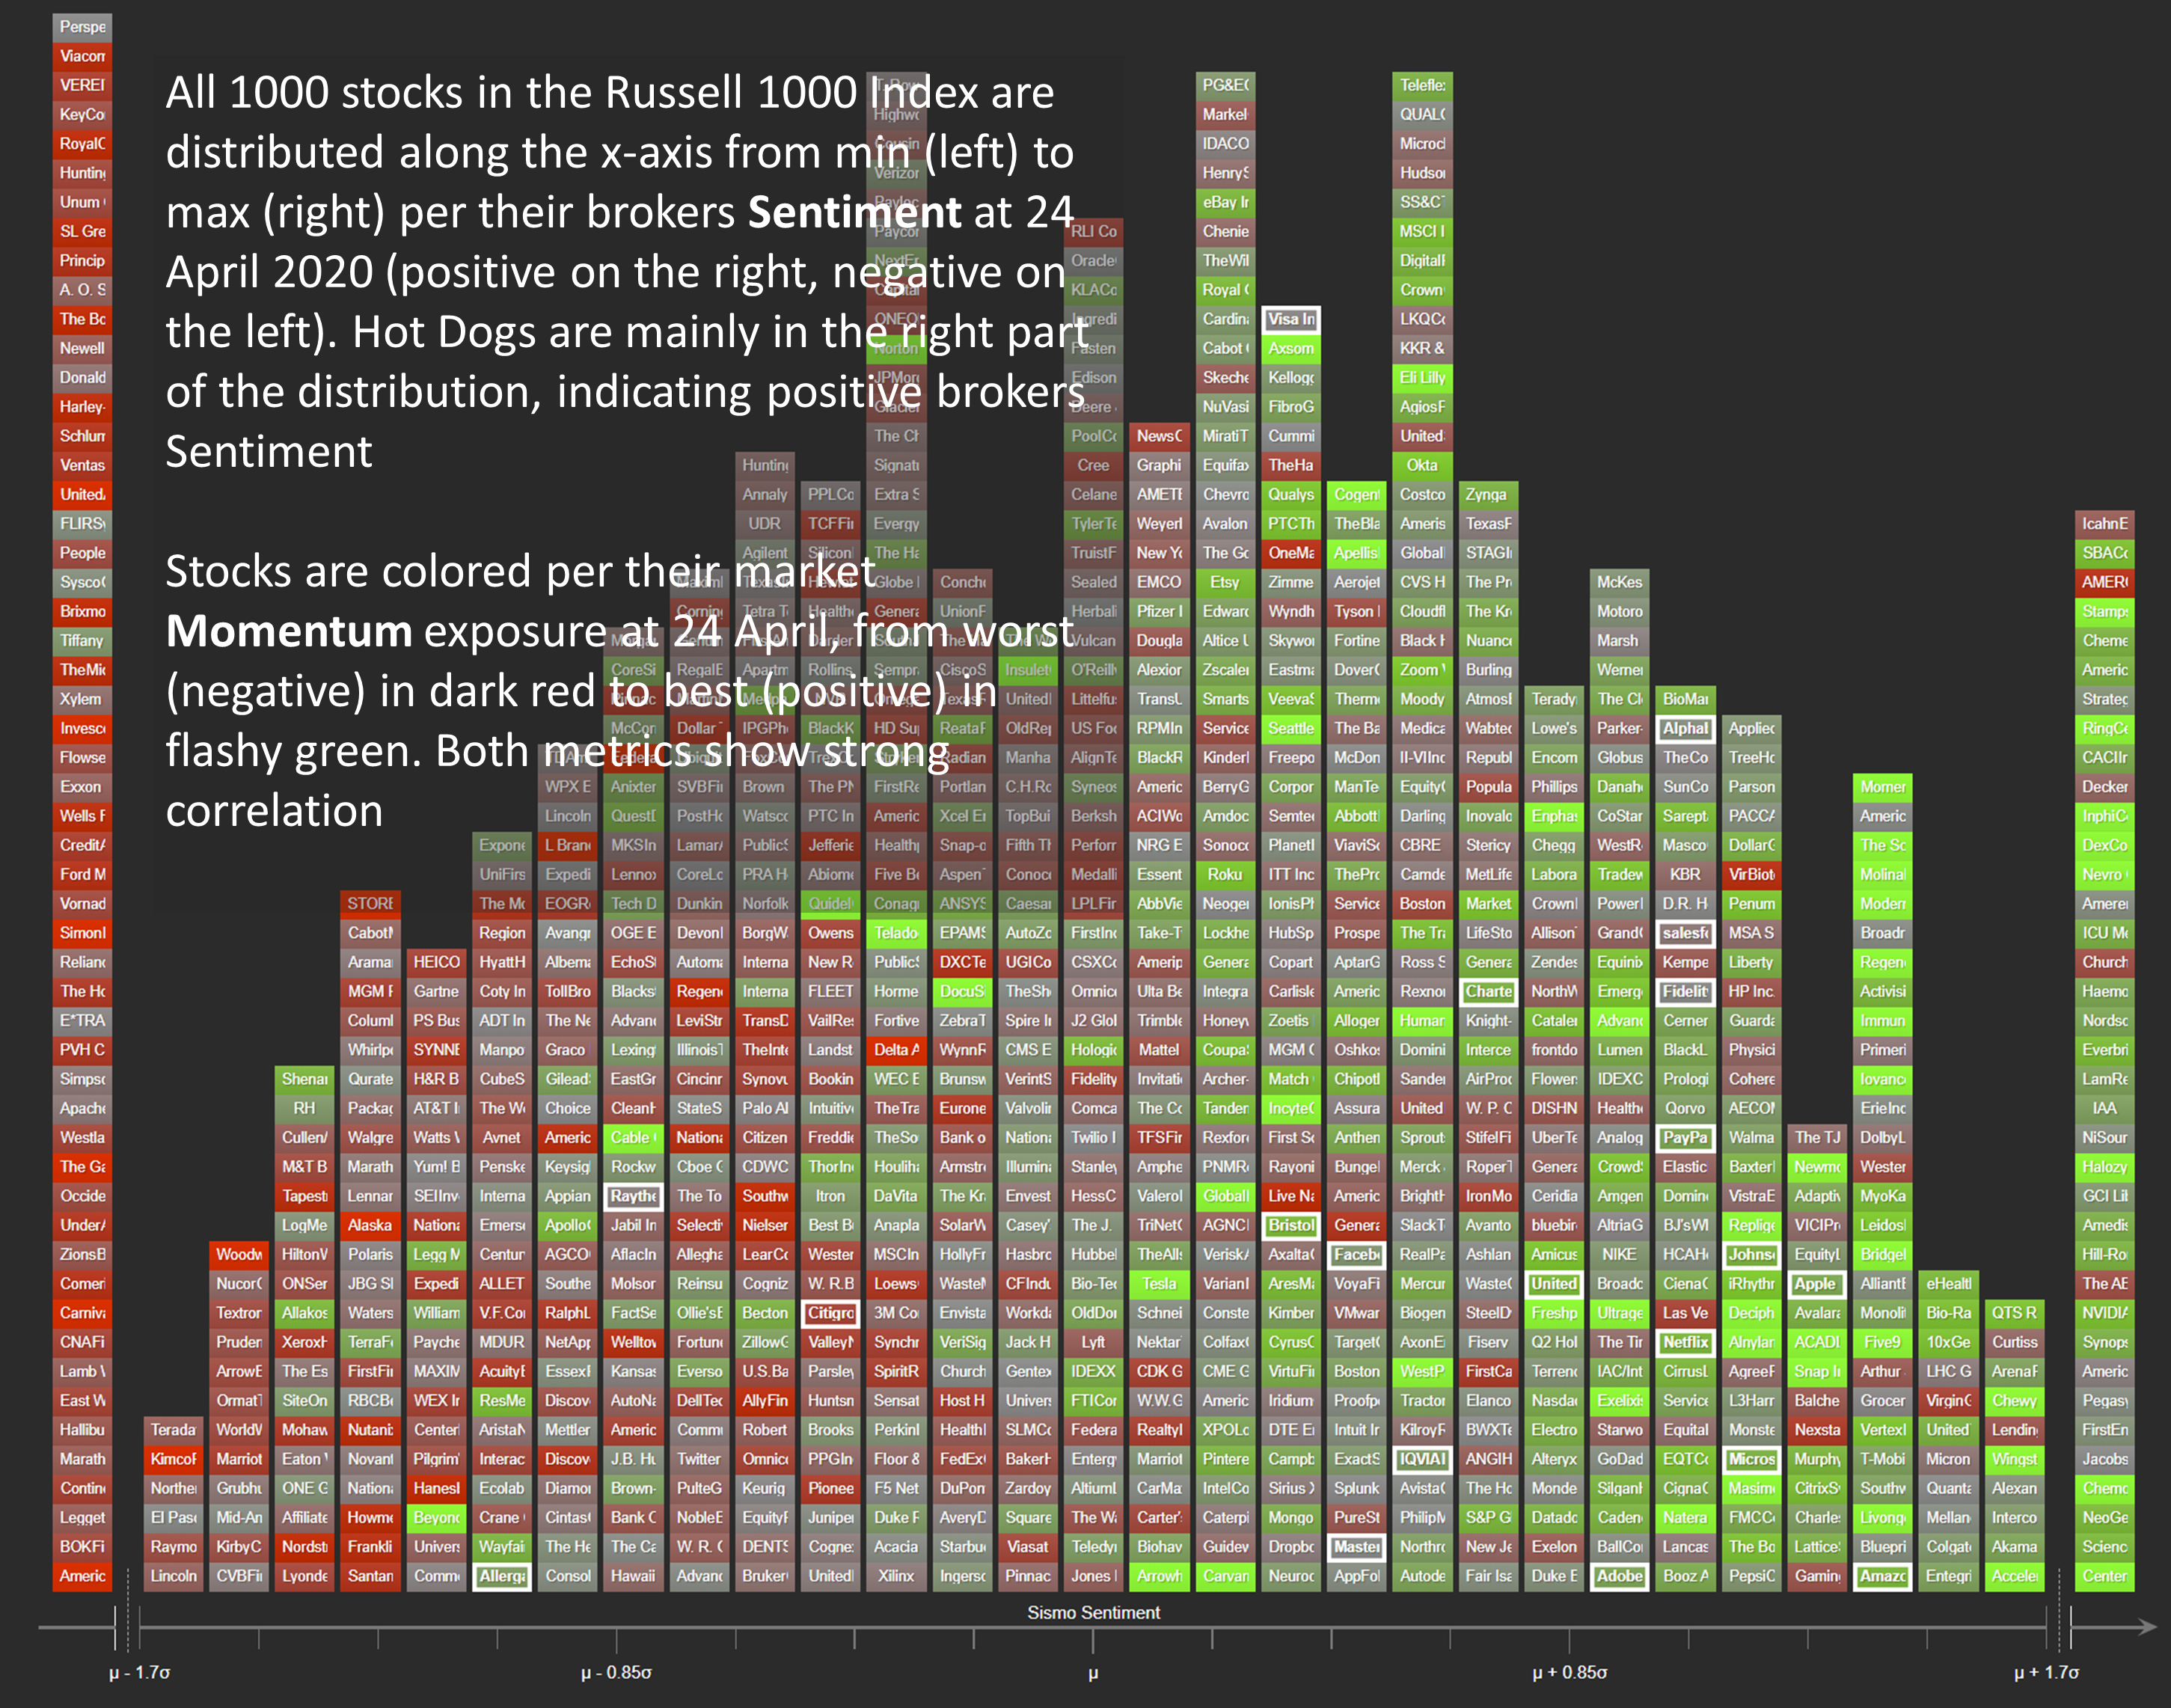
To get a visual confirmation of this, we display the distribution as of 24 April 2020 of the sell-side Sentiment (from min to max along the x-axis) of our universe of 1000 US stocks and color stocks per their relative Momentum, from red (underperformance) to green (out performance).
Distribution of Sentiment Factor vs Momentum Factor (color code) for top 1000 US stocks
Hedge-Funds Hot-Dogs highlighted (white circled) – As of 24 Apr. 2020
Sell-side optimism and positive price action have been highly correlated as of late as can be seen on this chart (with greenish tiles on the right side, reddish on the left). And most Hedge-Funds Hot-Dogs (here shown with white frame) are exposed to the corresponding correlation/reversal risk.
In a subsequent post, we will show how to use Sismo to look for potentially Covid-19 resilient companies with similar yet less crowded factor profile.
About Sismo
If this note sparked some interest and made you think, we would love to hear your comments at contact@sismo.fr. This study on the US equity market illustrates the analysis and visualization capabilities of Sismo, a visual analytics platform with direct web-access designed for discretionary equity portfolio managers that is integrated with European and US equity coverage from S&P.
Sismo combines innovative visualizations with advanced user interactions to facilitate the reading and understanding of market dynamics, select stocks, define and test investment strategies. It offers innovative screening and back-testing functionalities as well as investment style recognition and marginal portfolio optimization, leveraging on visual analysis capabilities to improve professionals’ investment decisions. Please visit www.sismo.fr.
Disclaimer : Past performances are not indicative of future performances. The information on this post is provided for information only and does not constitute, and should not be construed as, investment advice or a recommendation to buy, sell, or otherwise transact in any investment including any products or services or an invitation, offer or solicitation to engage in any investment activity.
3,055 total views, 5 views today
