
30 June 2020
Getting Better at Growth Screening : A Quick Guide to Drawing Up Stock Lists
See important disclaimer at the end of this article
We continue our series of articles which highlight how portfolio managers and analysts can take advantage of Sismo to identify stocks relevant to their own investment style and objectives. Our second use case illustrates how to build up a list of stocks matching user-defined Growth style criteria.
1. The Case for Mary
Mary is a Growth portfolio manager with a 20 year-experience in Europe equities (Stoxx 600). Having left her last position, she has enjoyed garden leave on a deserted island, with no access to any source of information over the last six months (lucky fellow!). Back to business, she discovers with amazement – and after the fact – the Covid crisis, the lockdown, the financial crash and the no less surprising market recovery.
Owing to stellar past performance, Mary is given sole responsibility for managing a new fund, starting with a hefty €100m of cash. her new challenge is to pick fastly growing European stocks in the current environment and invest wisely. Luckily, her new firm is equipped with Sismo, the quantamental assistant she’s been longing for.
To assess the growth of companies, Mary uses various Growth metrics, such as:
- Net Income growth based on current, past or forecasted earnings
- Sales growth, based on current, past or forecasted sales
- Free-Cash-Flow growth, based on current, past or forecasted cash flows
With Sismo comparative analysis charts, Mary can visualize at once such multiples (and many more indicators – see appendix) for all stocks in her investment universe, such as the Stoxx 600 or the Russell 1000. See this post for example.
But what if Mary wanted to have a synthetic view of each company’s relative valuation by combining all these indicators into a single one? That is precisely where Factors come into play.
2. Why Factors?
A precise description of Factors in Sismo is detailed in this post but the fast reader should keep in mind that a Factor is a composite indicator, ranging between -3 and +3, giving a synthetic view of multiple indicators, all at once.
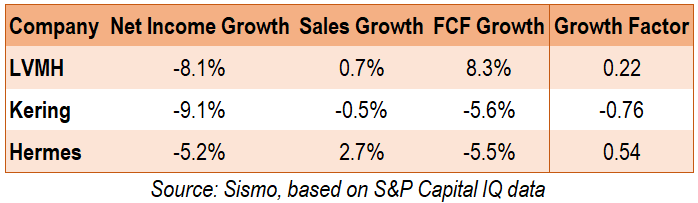
In the stylized example below, the review of individual indicators is inconclusive as to the relative growth of these stocks. However, based on the Growth Factor calculated on a universe of the top 600 European stocks, Hermes is the fastest growing company, Kering the slowest growing (or more precisely declining) company, while LVMH stands in the middle.
3. Creating Factors in Sismo
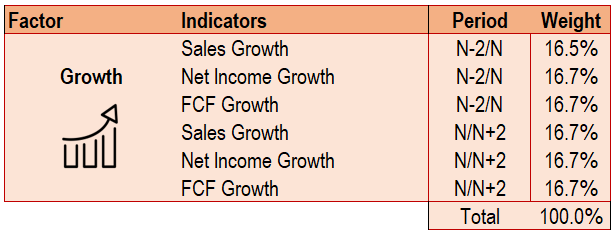
Each of the nearly 80 indicators (see Appendix) available in Sismo can be used as a component to a Factor. Each indicator can be individually weighted when defining the Factor. Mary goes on and creates her own Growth Factor, with the Sismo Factor builder:
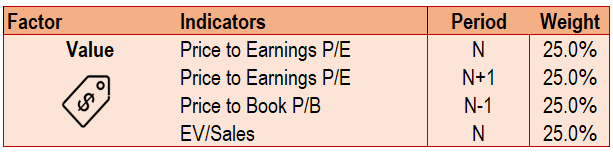
As an experienced portfolio manager, Mary is concerned by the excessive valuation such fast growing companies can reach. One way to protect against excessive valuations is to exclude stocks with the highest valuations measured over various trading multiples. Mary creates her own Value Factor with the following trading multiples:
4. Screening for Growth stocks with Sismo
Factors created and calculated on Mary’s relevant universe (Stoxx 600) can be visualized in Sismo:
All 600 stocks in the Stoxx 600 Index are distributed along the x-axis from min (left) to max (right) per their Growth Factor at 26 June 2020 (positive on the right side for fastly growing stocks, negative on the left side for slow Growth/declining stocks). Stocks are colored per their Value exposures at 26 June, from expensive in dark red to cheap in flashy green. Unsurprisingly, both metrics show very strong anti-correlation: stocks with high Growth perspective (i.e. on the right side of the distribution) are expensive from a Valuation standpoint. Some notable exceptions of stocks with high Growth but relatively cheap (stocks on the right, colored in flashing green): Fortum and Phoenix Group.
Exposures of the 600 European largest stocks to Growth (left to right) and Value (red to green) Factors
As of 26th June 2020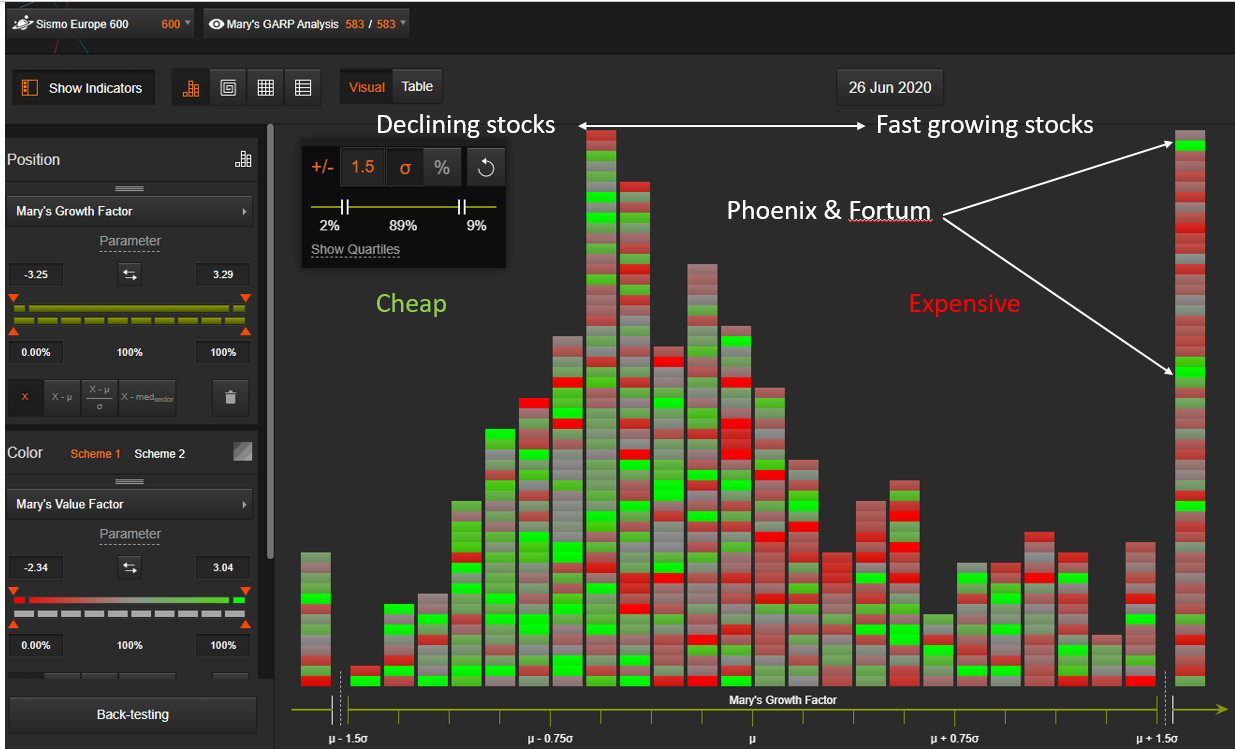
As Mary worries about excessive valuations, she decides to filter out the 30% stocks with the lowest exposure to the Value Factor. To this aim, she uses the filtering capacities of Sismo:
Exposures of the 600 European largest stocks to Growth (left to right) and Value (red to green) Factors
Exclusion of the 30% stocks with the highest valuations – As of 26th June 2020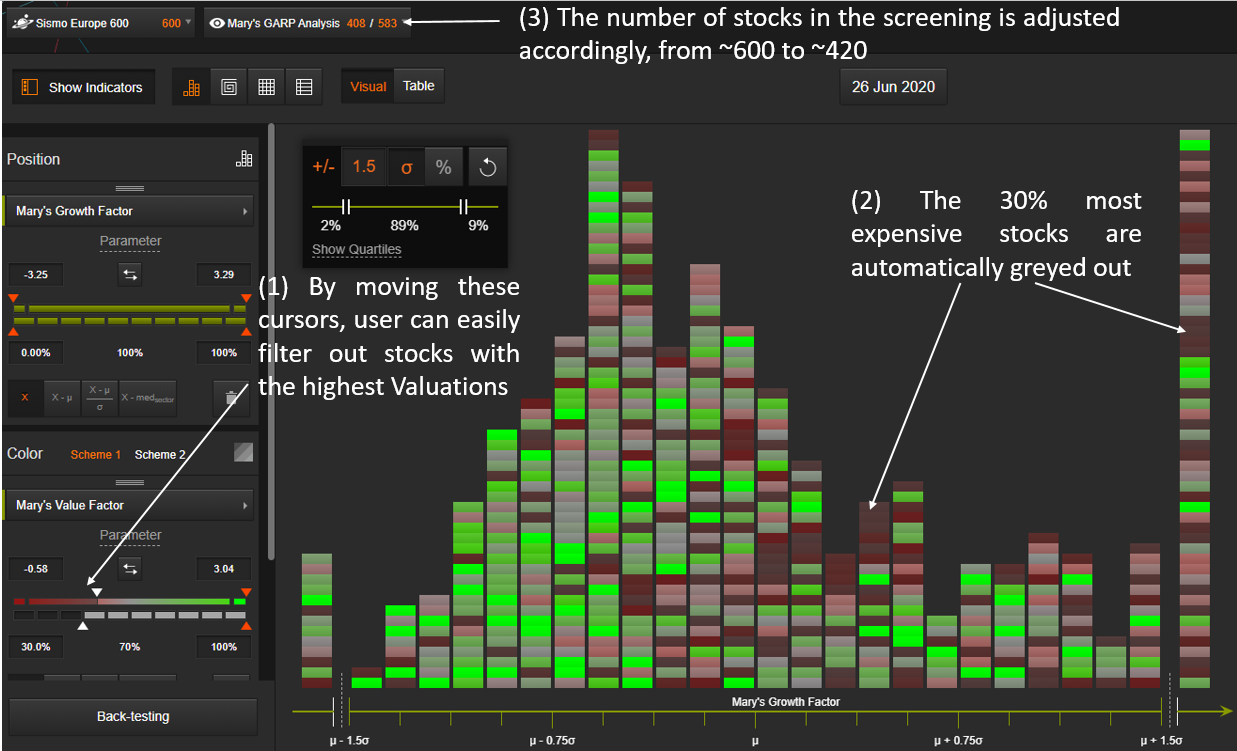
Now Mary filters the universe by the Value Factor to focus on the high Growth stocks on the right hand side of the distribution.
Exposures of the 600 European largest stocks to Growth (left to right) and Value (red to green) Factors
Filtering by Growth and Value – As of 26th June 2020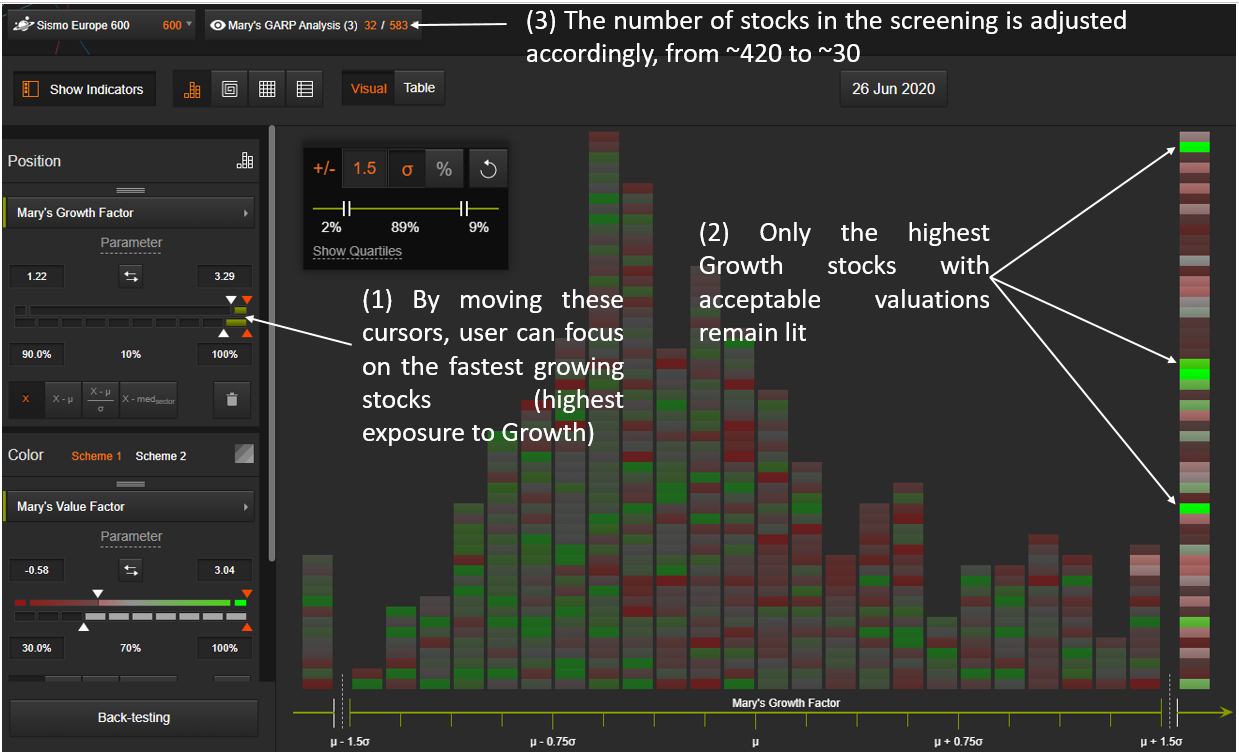
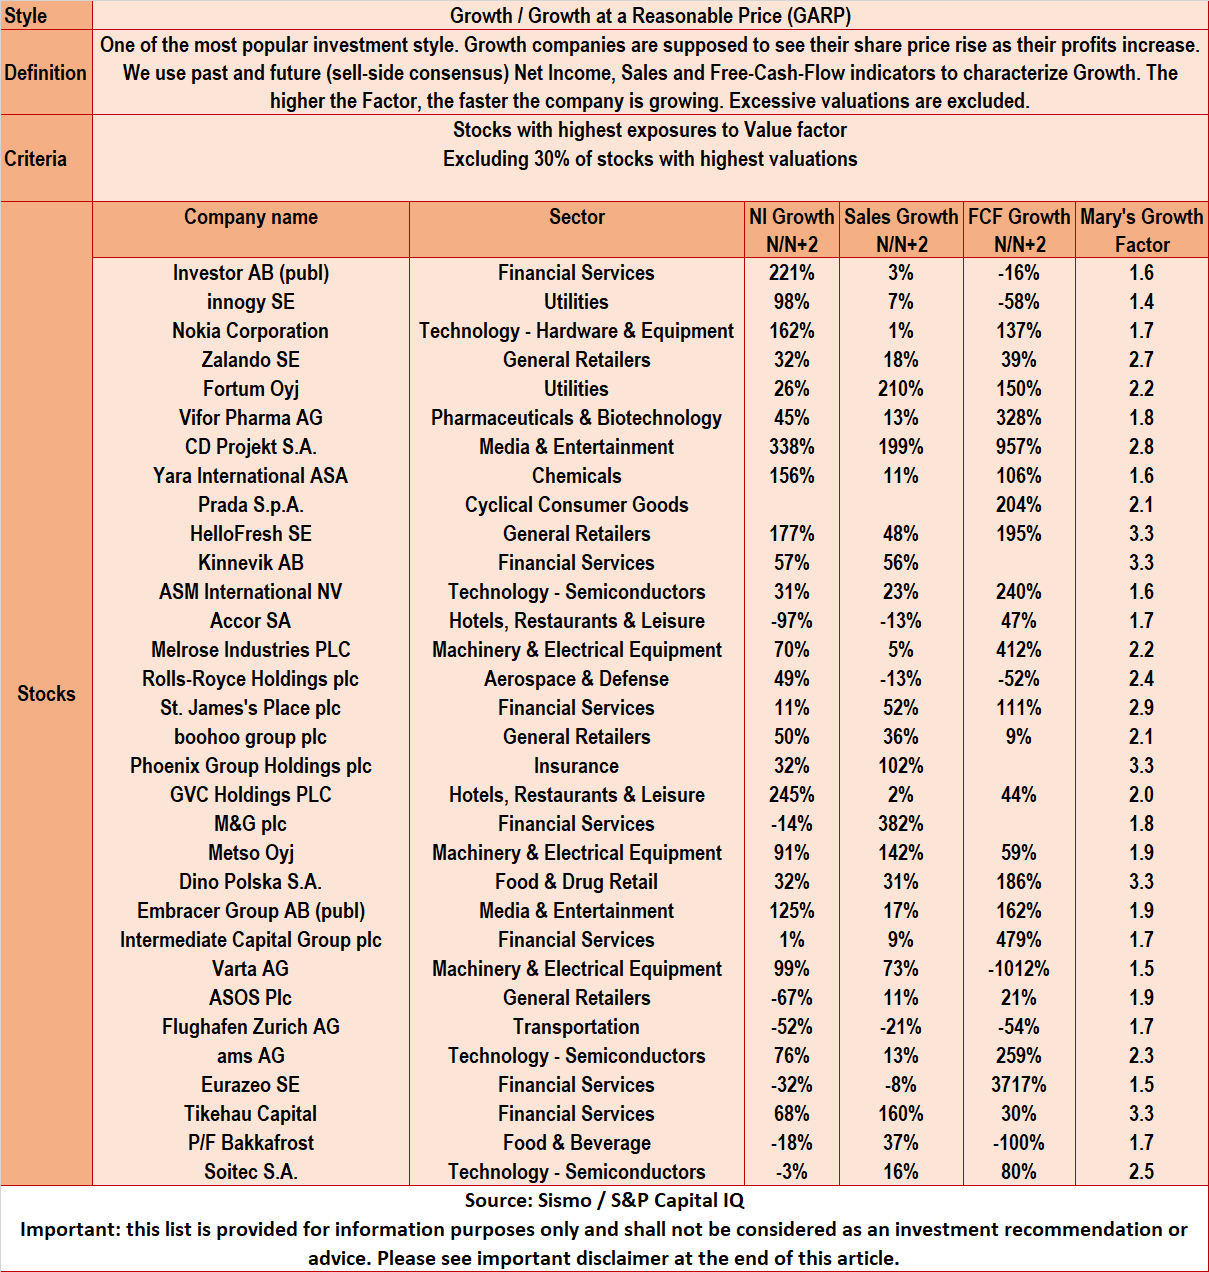
Mary can easily adjust this list of stocks by taking out or adding certain stocks. Once she’s satisfied with the result, she can save a “basket” list of such stocks for further analysis in Sismo or export it to Excel to share with her dealing desk. For information, the list of the 32 stocks is provided below.
5. Conclusion
This article was centered around the simplified case of a Growth manager but any portfolio manager can use the depth of indicators in Sismo to create her own custom factors and filters to efficiently screen the market for opportunities relevant to her/his investment style. While the screening functionalities are very relevant for a PM starting from a blank page, Sismo also offers the possibility to visualize the existing portfolio through the factor lens (for example in this post), spot outliers and find similar stocks using the Sismo peer search (for example in this post).
In future articles, we will provide similar use cases for other investment styles and investment universe. To read the case of the Value investor, please follow this link.
If this note sparked some interest and made you think, we would love to hear your comments at contact@sismo.fr.
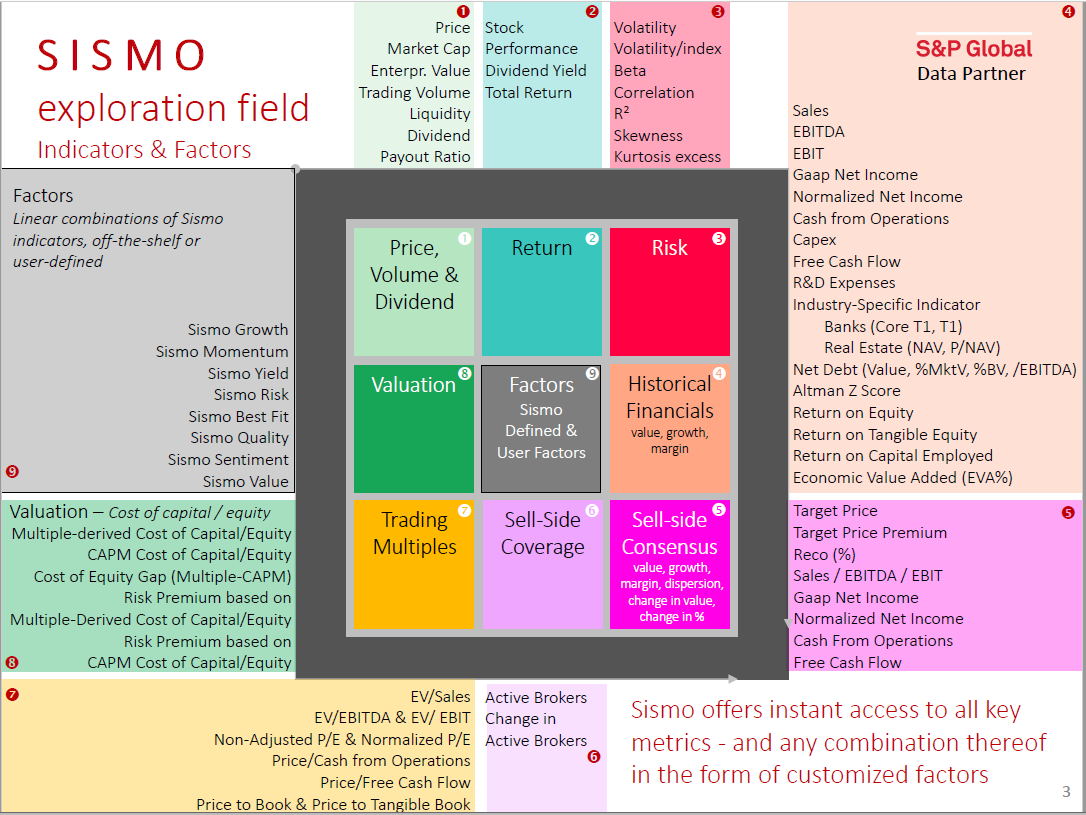
6. Appendix – list of available indicators
About Sismo
This study on the European equity market illustrates the analysis and visualization capabilities of Sismo, a visual analytics platform with direct web-access designed for discretionary equity portfolio managers that is integrated with European and US equity coverage from S&P.
Sismo combines innovative visualizations with advanced user interactions to facilitate the reading and understanding of market dynamics, select stocks, define and test investment strategies. It offers innovative screening and back-testing functionalities as well as investment style recognition and marginal portfolio optimization, leveraging on visual analysis capabilities to improve professionals’ investment decisions. Please visit www.sismo.fr.
Disclaimer : Past performances are not indicative of future performances. The information in this article is provided for information only and does not constitute, and should not be construed as, investment advice or a recommendation to buy, sell, or otherwise transact in any investment including any products or services or an invitation, offer or solicitation to engage in any investment activity.
3,218 total views, 2 views today